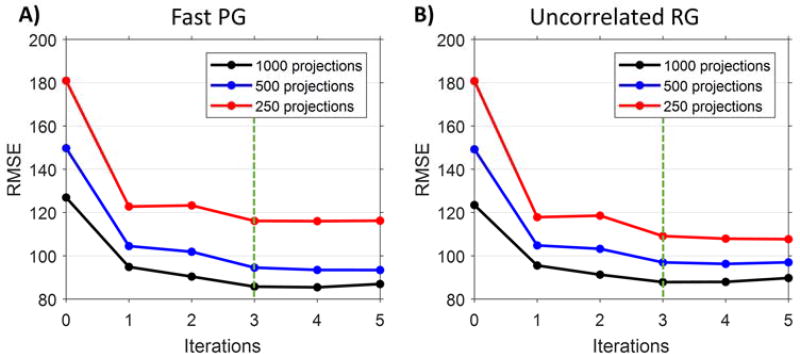
Figure 6.
RMSE as a function of the number of reconstruction iterations for A) fast PG and B) uncorrelated RG. Calculations were performed in a volume of interest (figure 5a) around the heart and averaged for all ten reconstructed cardiac phases. The RMSE values plateau after 3 iterations; this iteration was used in all quality measurements and analysis.

