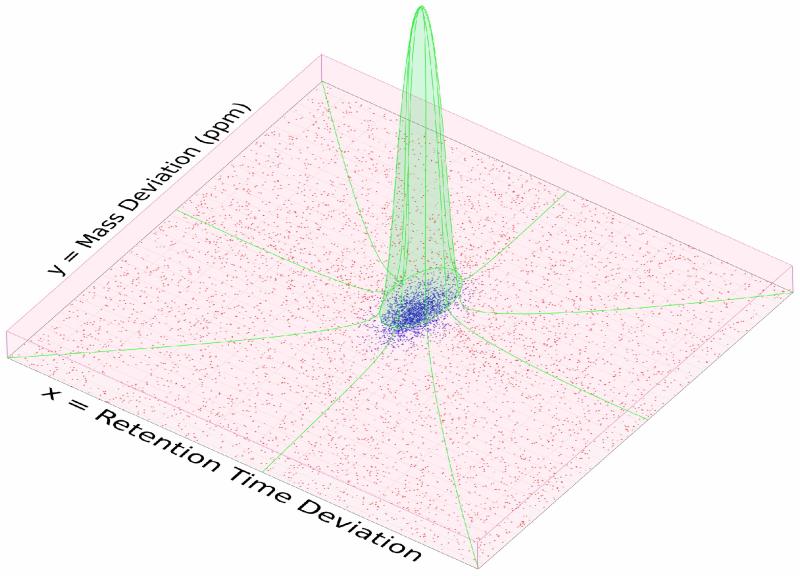
Figure 1.
An illustration of the mixed distribution of AMT database matches across the two-dimensional space of Mass and NRT match error. Points indicate individual AMT matches. Red box represents the near-uniform distribution of false matches. Green region indicates the bivariate normal distribution of true matches. Coloration of individual points indicates probability as assigned by the EM algorithm: reddest points indicate p=0, bluest points indicate p=0.96.

