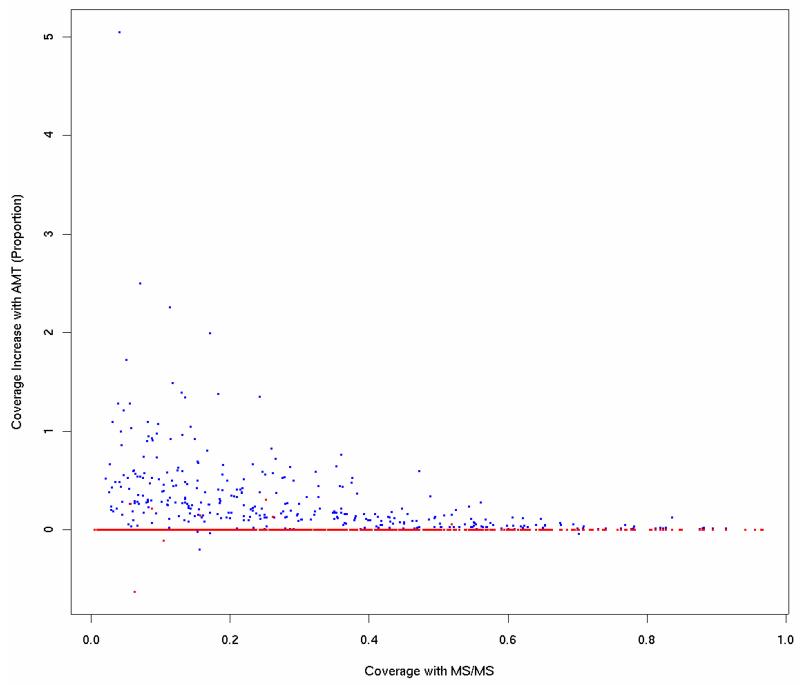
Figure 2.
Fold increase in amino acid coverage of proteins with AMT peptide identifications (vertical axis) vs. percent amino acid coverage using only MS/MS peptide identifications (horizontal axis). Blue points show coverage increase when matching to a target AMT database; red points show a decoy database match (only 6 proteins with increased coverage).

