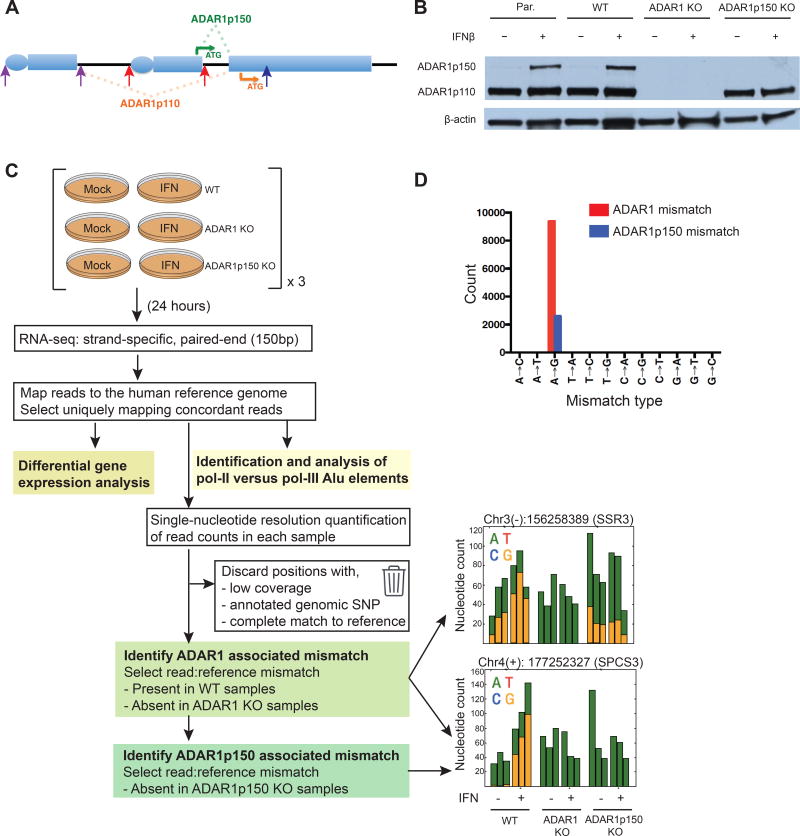
Figure 1. RNA-Seq analysis pipeline to determine the ADAR1 editome.
(A) Two isoforms of ADAR1 are generated by usage of different promoters and alternative splicing. Pc, constitutively active promoter that initiates transcription of exon 1B. Pi, interferon inducible promoter that initiates transcription of exon 1A. Exon 1B or exon 1A splices to exon 2 leading to ADAR1p110 or ADAR1p150 expression, respectively. ATG designates the translational start site for ADAR1p110 (orange) or ADAR1p150 (green). Arrows indicate gRNAs targeting expression of ADAR1 (blue), ADAR1p150 (red), and ADAR1p110 (purple) (see Tables S1 and S2 for more detail).
(B) Western blot of WT, ADAR1- and ADAR1p150 KO 293T cell clones after mock or IFNβ treatment. Par, parental 293T cell line.
(C, D) Schematic of comparative RNA-Seq analysis pipeline for the identification of ADAR1 and ADAR1p150-dependent mismatches, with examples of per sample nucleotide counts for both mismatch types (n = 3 independent clones for each genotype) (C). Pol II and pol III Alu elements refer to putative RNA polymerase II transcribed Alu elements, or RNA polymerase III transcribed Alu elements, respectively. Total mismatch counts associated with ADAR1 (red) and ADAR1p150 (blue) (D). All mismatch sites identified are listed in Tables S3 and S4.

