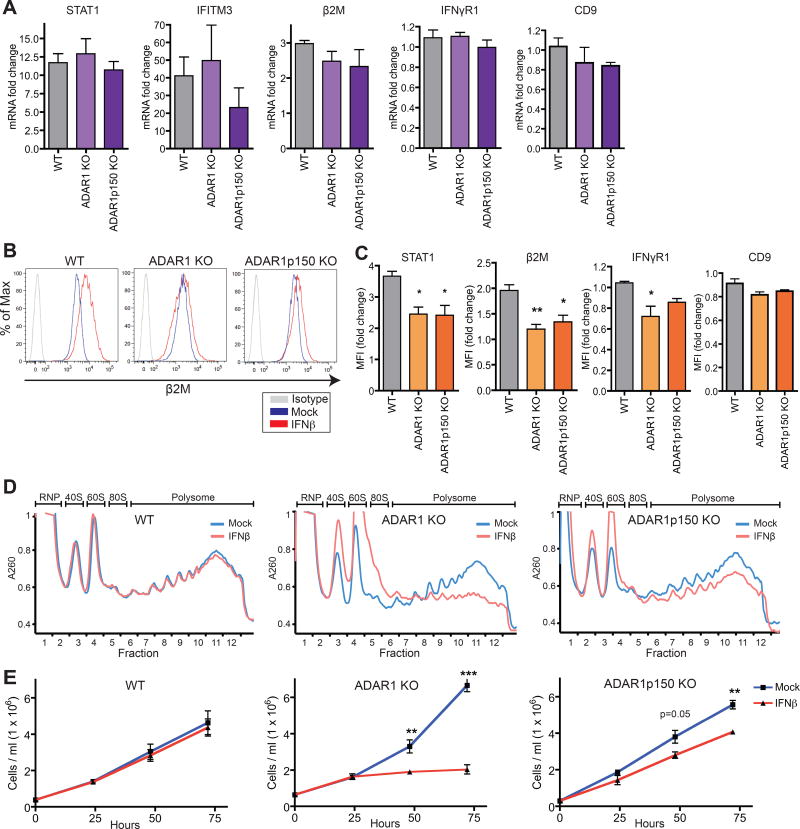
Figure 3. ADAR1 prevents global translational shutdown and cell growth arrest during IFN response.
(A–D) WT or ADAR1-deficient 293T cells were treated with IFNβ (24 hours). ISG mRNA fold change upon IFN treatment measued by qRT-PCR (A). β2M protein expression (B) and mean fluorescence intensity (MFI) fold change measured by flow cytometery upon IFN treatment (C). Polysome gradients (D). RNP, ribonucleoprotein. 40S, 60S and 80S denote the corresponding ribosomal subunits and monosome, respectively. Polysome, translating ribosomes bound to transcript. Data shown as mean ± SEM. n = 3 cell clones for each genotype. One-way ANOVA and Tukey’s post hoc test, *P < 0.05, **P < 0.01.
(E) Cell density during IFN treatment. Data shown as mean ± SEM (n = 3 experimental replicates). Student’s t-test, **P < 0.01, ***P < 0.001.
See also Figures S3 and S4.

