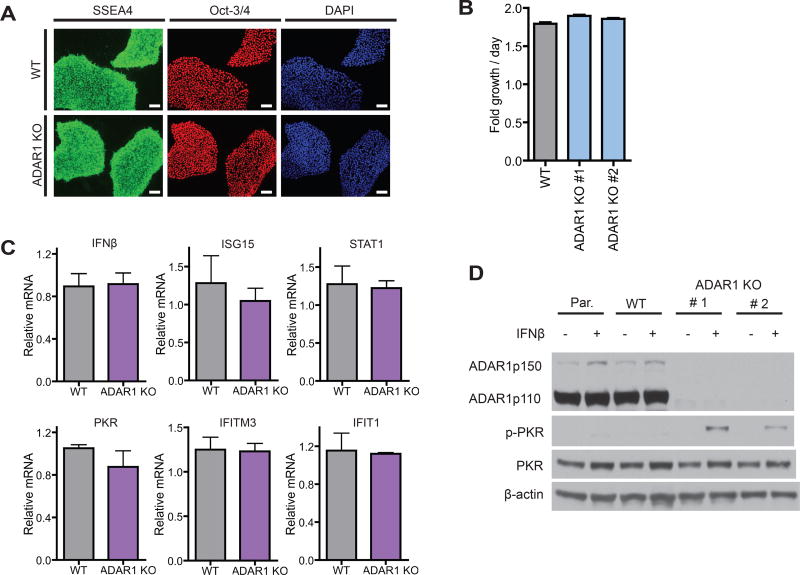
Figure 6. Generation and characterization of ADAR1 KO hESCs.
(A) Immunofluorescence staining of WT and ADAR1 KO hESCs. SSEA4 (green), Oct-3/4 (red), and DAPI (blue). Scale bar, 100um.
(B) hESC growth rate/day measured by the CellTiter-Glo assay.
(C) qRT-PCR of IFNβ and ISGs. Data shown as mean ± SEM (n = 3~6 experimental replicates).
(D) Western blot of mock and IFNβ treated (24 hours) hESCs. p-PKR, PKR phosphorylation.
(A–D) Par., parental hESC clone. WT, CRISPR/Cas9 derived WT hESC cell clone. ADAR1 KO #1 and #2 are two independent CRISPR/Cas9 derived ADAR1 KO hESC clones (see Table S2).

