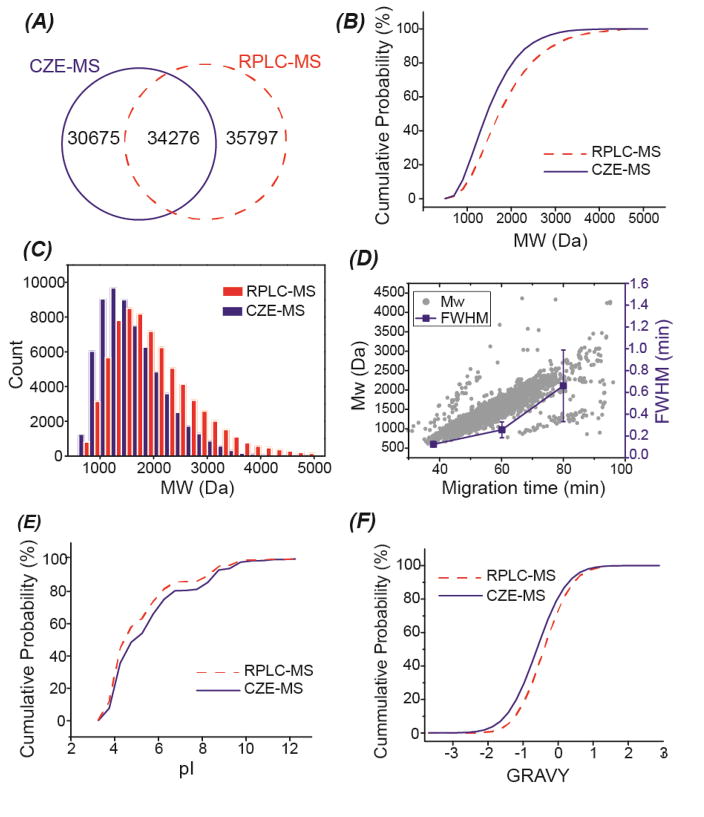
Fig. 4.
Comparison of SCX-RPLC-CZE-MS/MS and 2D-LC-MS/MS in terms of the identified peptides from the mouse brain proteome digest. (A) Overlap of identified peptides. (B) Cumulative distribution of molecular weight (MW) of identified peptides. (C) Bar graph of the MW distribution of the identified peptides. (D) Correlation between migration time and MW, migration time and FWHM of identified peptides from one random CZE-MS run. The FWHM of peptides at the three different migration time were calculated based on five randomly chosen peptides. The mean and the standard deviations of the FWHM of those five peptides were shown in the figure. (E) Cumulative distribution of the isoelectric point (pI) of identified peptides. (F) Cumulative distribution of the grand average of hydropathy (GRAVY) value of the identified peptides. Negative GRAVY values indicate hydrophilic; Positive GRAVY values signify hydrophobic.

