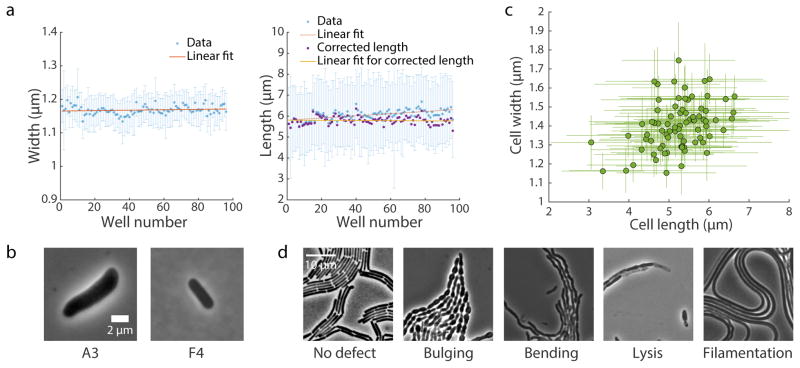
Figure 3. Typical results from SLIP.
(a) Changes in mean cell width (left) and length (right) during imaging of an E. coli MG1655 culture in exponential growth transferred to all 96 wells of a plate. Twenty-five images (5x5 grid) were acquired at each well to visualize enough cells for accurate quantification of cellular dimensions. Image acquisition required ~12 min. Due to growth on the pad, cell length increased by ~10% from the first well to the 96th, while cell width remained roughly constant. Blue data points are mean ± standard deviation. Red lines are the best linear fit of mean values. Purple data points are cell length corrected for the linear growth effect represented by the red line, and the linear fit to the corrected data is shown in yellow. For clarity, the error bars for purple data points are not shown. (b) Typical images from a SLIP screen of E. coli MreB-msfGFP mutants. Mutants with altered cell dimensions (larger or smaller) are easily identified. (c) Cellular dimensions of strains in an MreB-msfGFP mutant library quantified by the MATLAB software package Morphometrics17. Data points are mean ± standard deviation (n > 200 cells per strain). (d) Typical terminal phenotypes of strains in a B. subtilis CRISPRi essential gene knockdown library, where cells were grown on an agar pad with the CRISPRi inducer xylose overnight to deplete one essential protein in each strain. Wild-type cells showed no shape defect and grew into homogeneous lawns (left), whereas we visually identified a variety of morphological and/or growth defects by depleting essential proteins.

