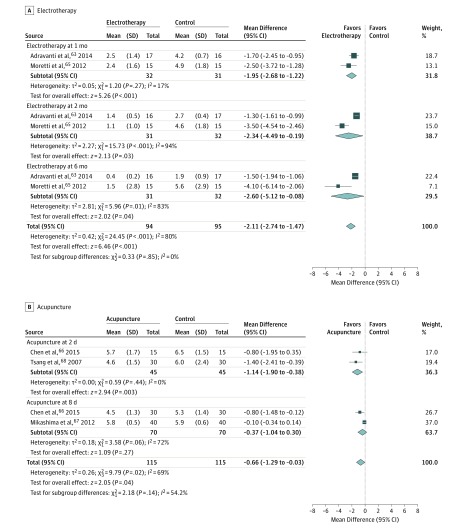
Figure 1. Pain Relief and Analgesic Consumption.
Shown are individual and pooled weighted mean differences in pain measured with a visual analog scale using the inverse variance method. A, The mean differences at 1, 2, and 6 months after surgery. B, The mean differences at 2 days and 8 days after surgery. A random-effects model was used to pool the data.

