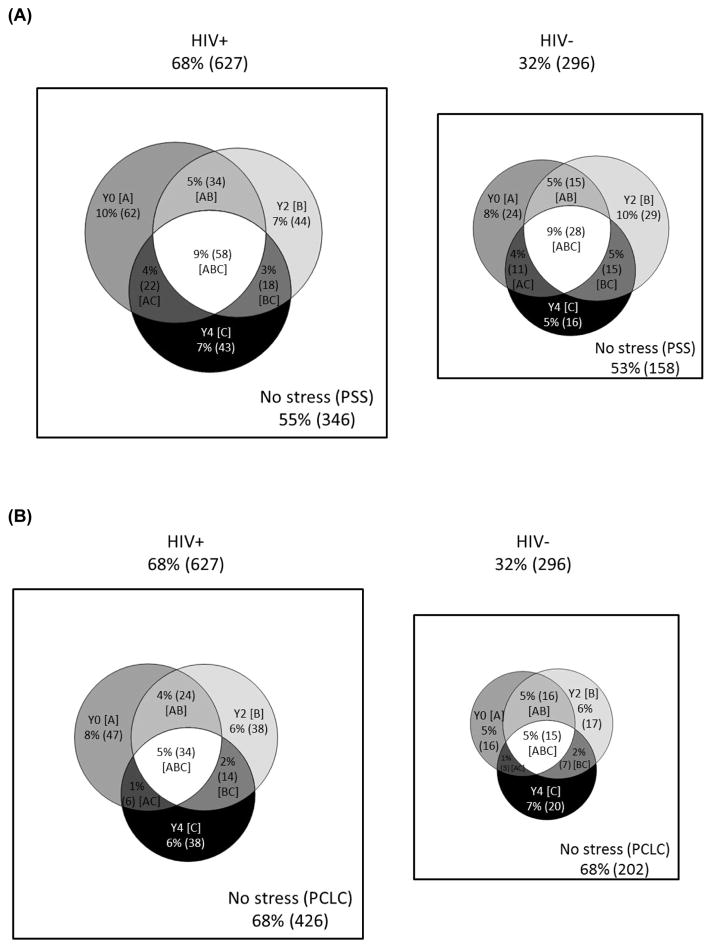
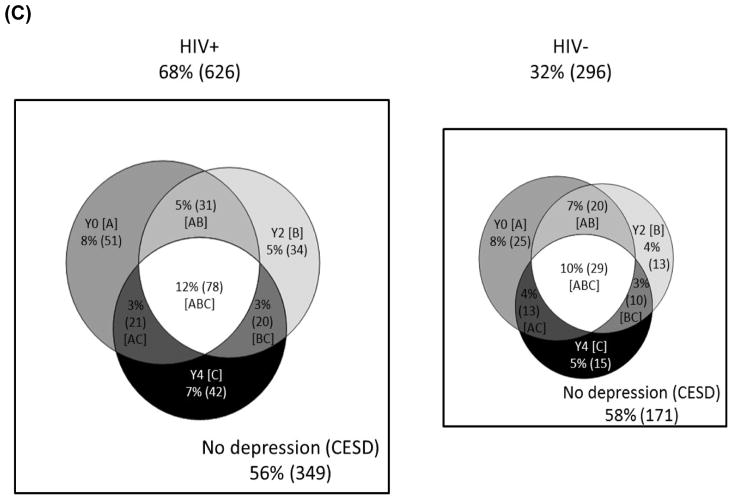
Figure 1.
(A) Comparative Venn diagrams depicting perceived stress exposures over time. Cells are mutually exclusive. Stress indicated by PSS-10 at [A] Y0 (baseline only); [B] Y2 (year 2 only); [C] Y4 (year 4 only); [AB] Y0 and Y2; [AC] Y0 and Y4; [BC] Y2 and Y4; [ABC] Y0, Y2, and Y4. PSS-10=Perceived Stress Scale-10
(B) Comparative Venn diagrams depicting post-traumatic stress exposures over time. Cells are mutually exclusive. Stress indicated by PCL-C at [A] Y0 (baseline only); [B] Y2 (year 2 only); [C] Y4 (year 4 only); [AB] Y0 and Y2; [AC] Y0 and Y4; [BC] Y2 and Y4; [ABC] Y0, Y2, and Y4. PCL-C=PTSD symptom checklist
(C) Comparative Venn diagrams depicting depression exposures over time. Cells are mutually exclusive. Depression indicated by CES-D at [A] Y0 (baseline only); [B] Y2 (year 2 only); [C] Y4 (year 4 only); [AB] Y0 and Y2; [AC] Y0 and Y4; [BC] Y2 and Y4; [ABC] Y0, Y2, and Y4. CES-D=Center for Epidemiological Studies Depression


