Figure 6.
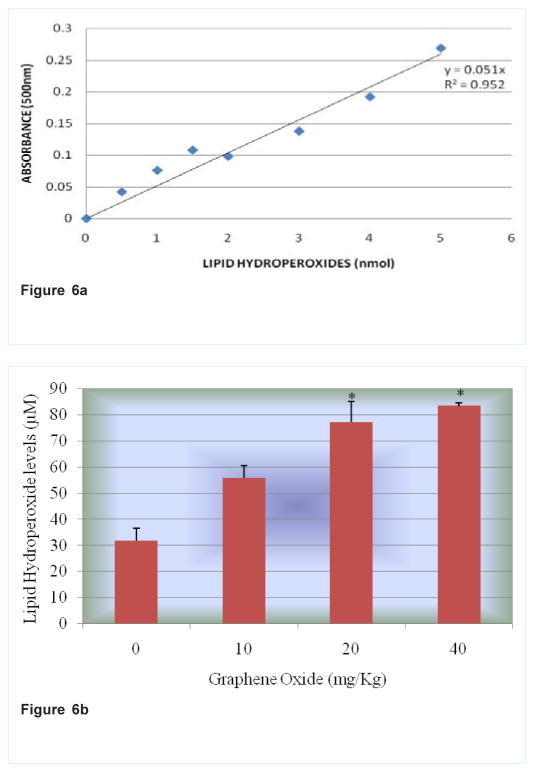
Figure 6a: Standard curve for Lipid Hydro Peroxides (LPO) assay where y-axis represents absorbance at 500nm whereas x-axis represents the concentrations of reference standard (nmol).
Figure 6b: Effect of Graphene Oxide on Lipid Hydro Peroxide. Each bar represents mean ± SD of five rats. Values with asterisks were significantly different from control.

