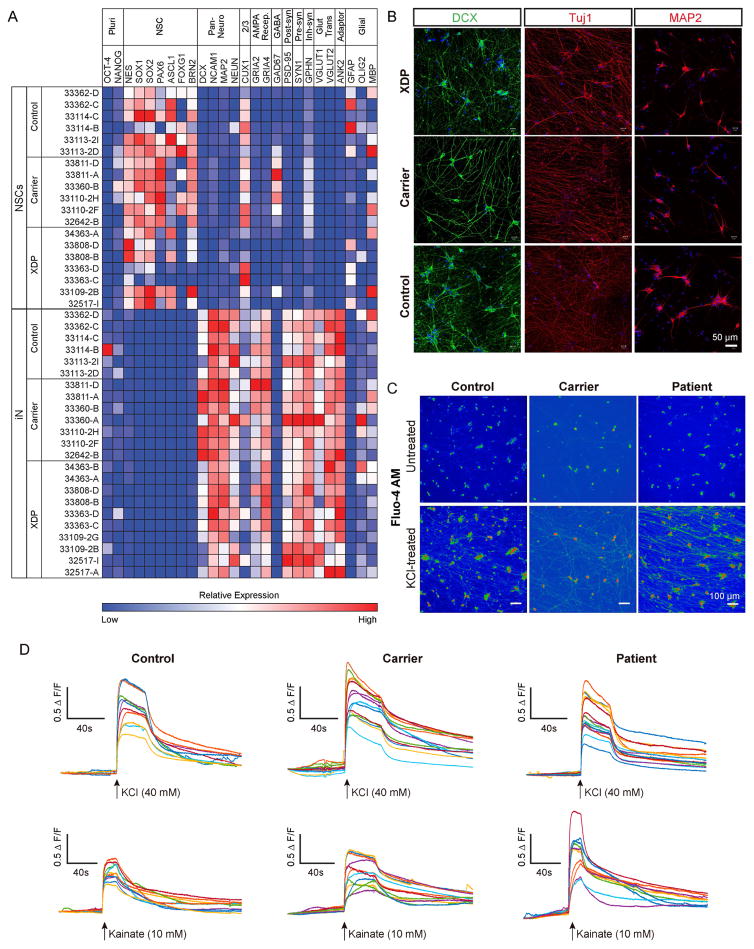
Figure 3. Characterization of iPSC-derived NSCs and NGN2-induced cortical neurons.
(A) Heatmap of relative expression of pluripotency, neural stem cell, neuronal and glial genes in NSCs and iNs based on RNAseq. (B) Representative images from proband, carrier female, and control iNs showing processes stained with doublecortin (DCX), βIII-tubulin/Tuj, and MAP2. (C) Ca2+ mobilization in iNs visualized via Fluo-4AM. Upper and lower panels show Fluo-4AM fluorescence before and after, respectively, KCl treatment in control (left panels), carrier (middle panels) and XDP (right panels) lines. (D) Representative traces show relative change in fluorescence intensity (ΔF/F) induced by KCl (upper panels) and kainate (lower panels) in control (left), carrier (middle) and patient (right) lines. Traces represent individual cells (n = 10-15 cells).

