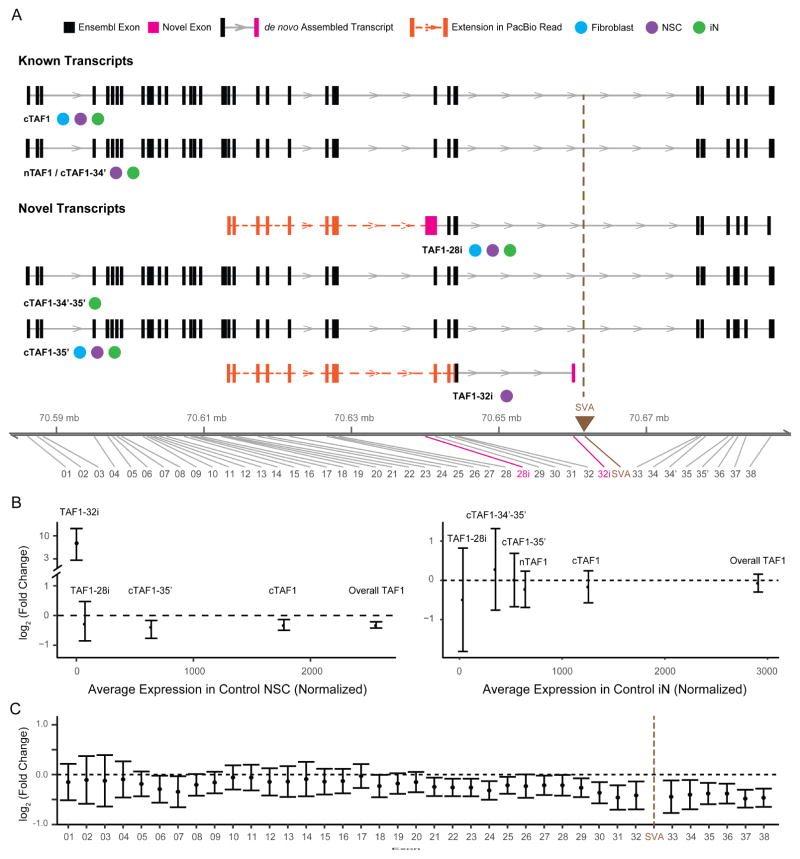
Figure 4. De novo assembly of TAF1 transcript structure and differential expression of splice variants.
(A) Transcript structure from de novo assembly depicts TAF1 isoforms previously annotated in Ensembl and additional splice variants detected in this study. For each transcript, boxes denote exons in black (Ensembl-annotated) or pink (this study). Brown triangle indicates genomic position of the SVA. Notation is provided for the cell type in which each transcript was detected. Extension of the transcript assembled from Illumina short reads by the PacBio data are indicated by a dashed orange line with additional exons represented by orange boxes. The genomic coordinate reflects the insertion of SVA (2627 bp). (B) Relative expression abundance of each TAF1 transcript in controls (x-axis) and relative change in TAF1 transcripts in XDP probands compared to controls (y-axis) in NSC (left) and iNs (right). Error bars reflect FDR correction of 95% confidence interval. (C) Relative expression of each exon of cTAF1 in XDP NSCs relative to controls. Black dashed line represents no change.

