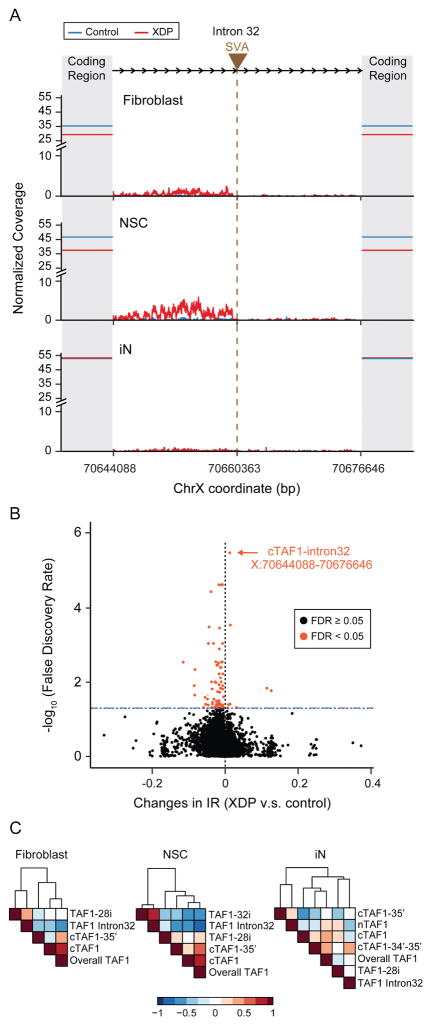
Figure 5. Aberrant expression of TAF1 intron 32 and transcriptome-wide significance in XDP NSCs.
(A) Composite plot demonstrates normalized Illumina sequencing coverage of TAF1 intron 32 in control (blue) and XDP (red) samples across three cell lines. Brown triangle and the vertical brown line indicate the SVA insertion site while shadowed areas represent TAF1 coding regions. Solid horizontal lines intersecting the Y axis show the average sequencing coverage of the TAF1 coding region in control (blue) and XDP (red) samples. X axis represents the genomic coordinates of human X chromosome with the SVA inserted. (B) Transcriptome-wide levels of IR among all 258,852 annotated introns in XDP vs. control NSCs (x-axis) plotted against significance levels (y-axis, log10 transformed). Significant IR changes (FDR < 0.05) are marked in orange. (C) Expression correlations among TAF1 intron 32 expression, overall TAF1 expression and TAF1 transcripts in fibroblasts (left), NSCs (middle) and iNs (right). Colors indicate Spearman correlation coefficients. Rows and columns are clustered based on Euclidean distance.

