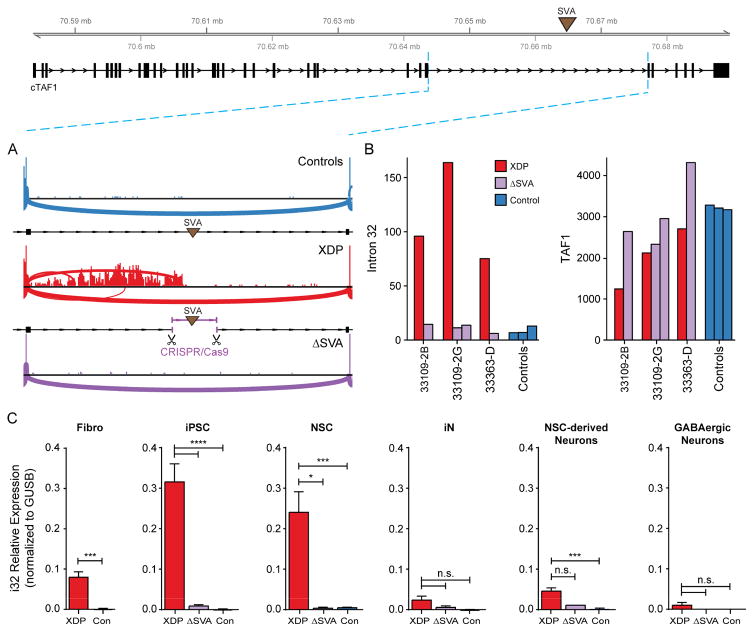
Figure 6. Excision of the SVA rescues aberrant splicing and expression in intron 32 and expression of TAF1.
(A) Sashimi plot depicting coverage and splicing in intron 32 of TAF1 in control, XDP, and SVA-excised (ΔSVA) proband NSCs. (B) Normalized RNA-Seq counts in intron 32 of TAF1 5′ to the SVA insertion (left) and TAF1 (right) in proband NSCs, corresponding ΔSVA clones, and control cells (one clone per individual). (C) Relative expression of intron 32 splice variant in fibroblasts (Fibro), iPSCs, NSCs, iNs, NSC-derived cortical neurons, and GABAergic neurons from XDP, control, and ΔSVA lines. Graphs represent mean (+SEM) from clones generated for each cell type. See methods for total numbers and biological replicates of each genotype. Unpaired two-tailed t-test (fibro) or one-way ANOVA with Tukey’s multiple comparisons test was performed on each cell type. *p<0.05, ***p<0.001, ****p<0.0001, or n.s. = not significant.

