Figure 11.

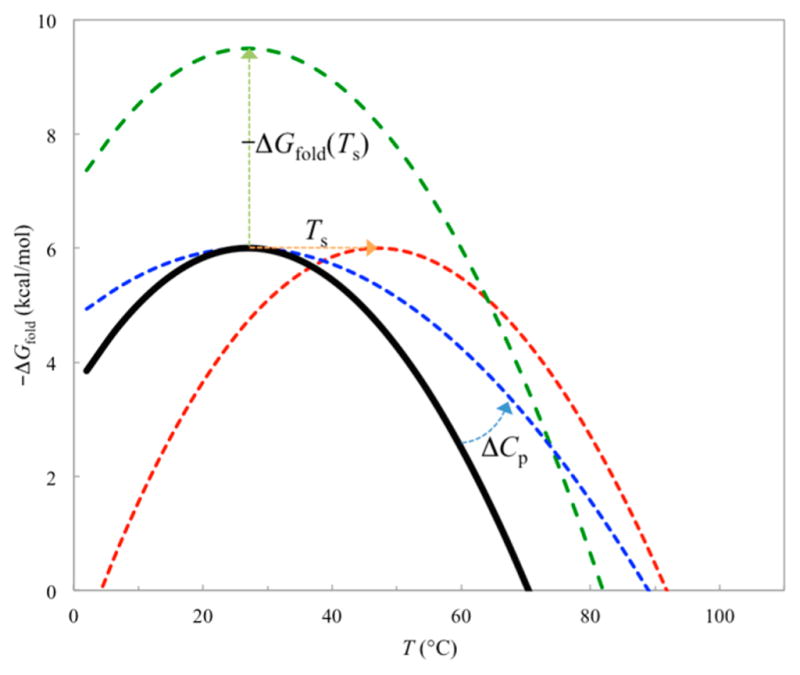
Temperature dependence of the unfolding free energy −ΔGfold. The melting temperature increases with increasing −ΔGfold(Ts), decreasing ΔCp, and increasing Ts, as illustrated by the green, blue, and red curves, respectively.

Temperature dependence of the unfolding free energy −ΔGfold. The melting temperature increases with increasing −ΔGfold(Ts), decreasing ΔCp, and increasing Ts, as illustrated by the green, blue, and red curves, respectively.