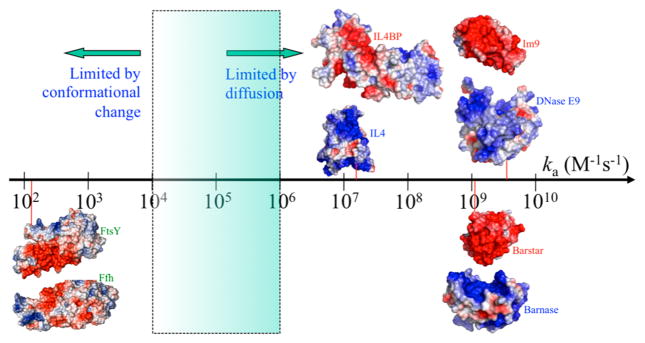
Figure 16.
Wide spectrum of values for the rate constants (ka) of protein–protein association. Four pairs of proteins are illustrated by their electrostatic surfaces; in each pair, the partner proteins are separated and rotated just enough to expose the binding interface. Red vertical lines indicate experimental ka values (at low ionic strengths when data available) for DNase E9 and Im9,539 barnase and barstar,540 interleukin 4 (IL4) and IL4 binding protein (IL4BP),541 and FtsY and Ffh (in the absence of RNA).542 Significant charge complementarity is present in the first three protein pairs. For FtsY and Ffh, charge complementarity is present to some degree between the N subdomains (toward the left), which were implicated in forming the interface of a kinetic intermediate,543,544 but absent between the G subdomains (to the right), which form the interface in the native complex.545,546

