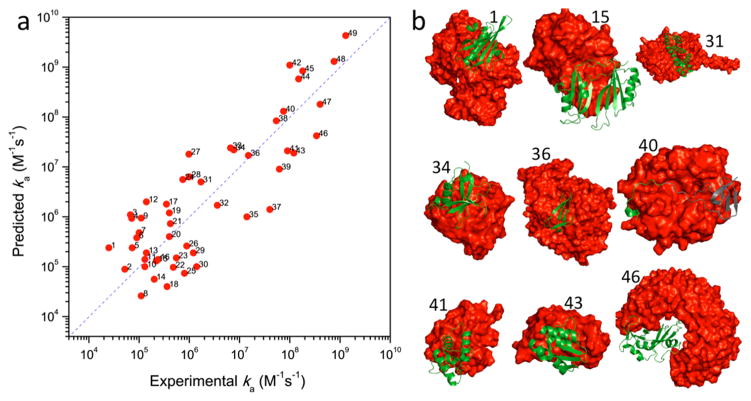
Figure 17.
Sample results from the TransComp web server. (a) Comparison between predicted and experimental ka values for 49 protein complexes. Ionic strengths were chosen to be close to a physiological value (i.e., 0.15 M) when possible. Reprinted with permission from ref 457. Copyright 2011 Elsevier. (b) Collage of structures for a subset of the 49 protein complexes. Protein structures were modified in two cases before TransComp calculations: for 40 (hirudin and thrombin), only the docking segment (shown in green ribbon) of hirudin was used; for 46 (ribonuclease A and inhibitor protein), the cleft of the inhibitor protein (red surface) was widened by a normal-mode analysis based on an elastic network model.

