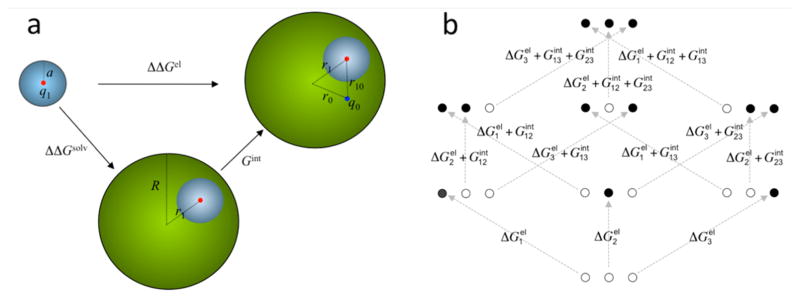
Figure 4.
(a) Difference (ΔΔGel) in the electrostatic energies for creating a charge q1 in a model compound (small sphere) and in a protein (large sphere). The model compound becomes buried in the protein, resulting in the desolvation cost ΔΔGsolv. Interaction with a preexisting protein charge q0 contributes an additional energy Gint. This model can also be adopted for reduction potential and for protein folding. In those cases, the model compound becomes the redox center or a charged group of the protein. (b) Differences in electrostatic energies among the eight protonation states of a protein with three protonation sites. Solid and open circles represent charged and neutral sites, respectively. In the former case the net charge at each site can be either positive or negative. The situation for protonation inside the protein is shown. For the counterpart in the model compounds, there are no interactions among the three sites.

