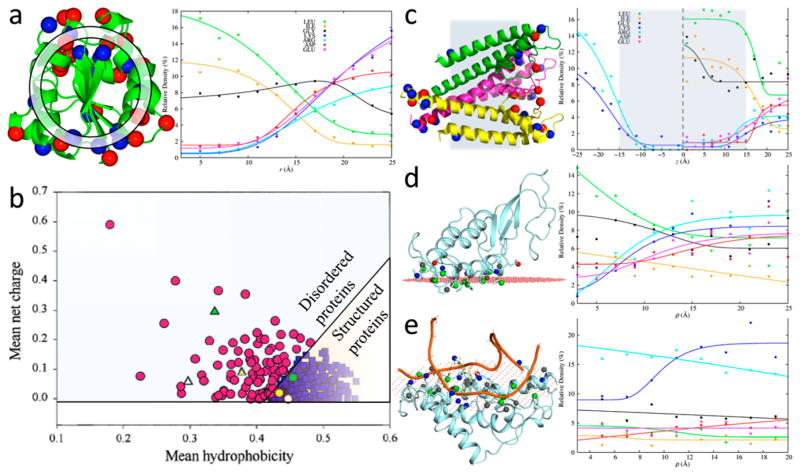
Figure 8.
Spatial distributions and compositions of residues in different types of proteins and interfaces. (a) Relative densities of residues along the radial distance in water-soluble proteins. (left) Basic and acidic residues are displayed as blue and red spheres, respectively; a spherical shell used for defining relative density is shown. (right) r dependences of relative densities of nonpolar, Gly, and charged residues. (b) Separation of intrinsically disordered proteins from structured proteins according to hydrophobicity and net charge, by the line q̄ = 2.785h̄ − 1.151. Adapted with permission from ref 221. Copyright 2000 John Wiley & Sons Ltd. (c) Relative densities of residues along the membrane normal in α-helical transmembrane proteins. (left) Basic and acidic residues are displayed as blue and red spheres, respectively; shaded region indicates the membrane hydrophobic core. (right) z dependences of relative densities of nonpolar, Gly, and charged residues. (d) Relative densities of residues along the two-dimensional radial distance ρ in protein–membrane interfaces. (left) Interfacial side chains are displayed as sticks, with tip atoms of basic, acidic, nonpolar, and other residues displayed as blue, red, green, and gray spheres, respectively; the membrane hydrocarbon boundary plane (as calculated in the OPM database222) is represented by red dots. (right) ρ dependences of relative densities of nonpolar, Gly, and charged residues. (e) Similar results for protein–nucleic acid interfaces.

