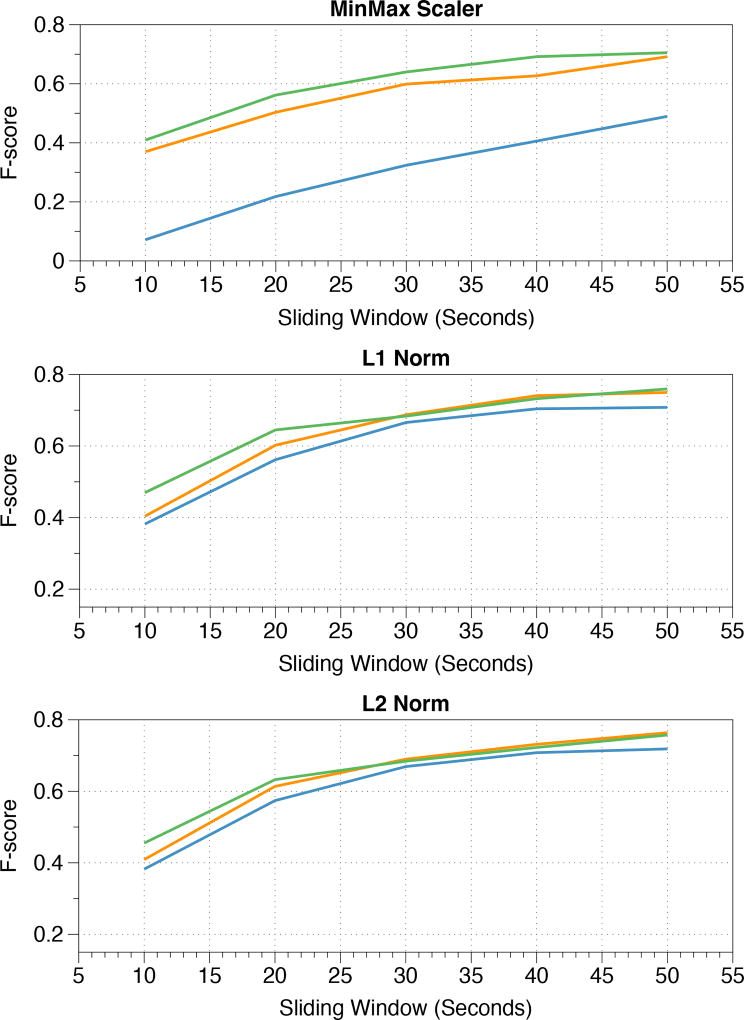
Figure 3.
In these graphs, it is possible to see the effect of sliding window size on eating detection performance (F-Score) across all participants in the lab study (LOPO). When L1 or L2 normalization is applied to the sensor data, it is possible to recognize eating activities with a wrist-mounted device on the non-dominant hand (blue line) almost as well as with a sensing device on the dominant hand (green line) or on both hands (yellow line).

