
Fig. 2.
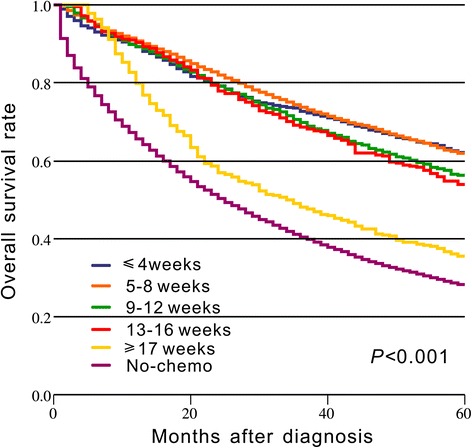
Kaplan–Meier curve of the timing of chemotherapy and overall survival. The p value is derived from log-rank test for the overall comparison of overall survival between different timing of chemotherapy and non-chemotherapy group
Official websites use .gov
A
.gov website belongs to an official
government organization in the United States.
Secure .gov websites use HTTPS
A lock (
) or https:// means you've safely
connected to the .gov website. Share sensitive
information only on official, secure websites.
Kaplan–Meier curve of the timing of chemotherapy and overall survival. The p value is derived from log-rank test for the overall comparison of overall survival between different timing of chemotherapy and non-chemotherapy group