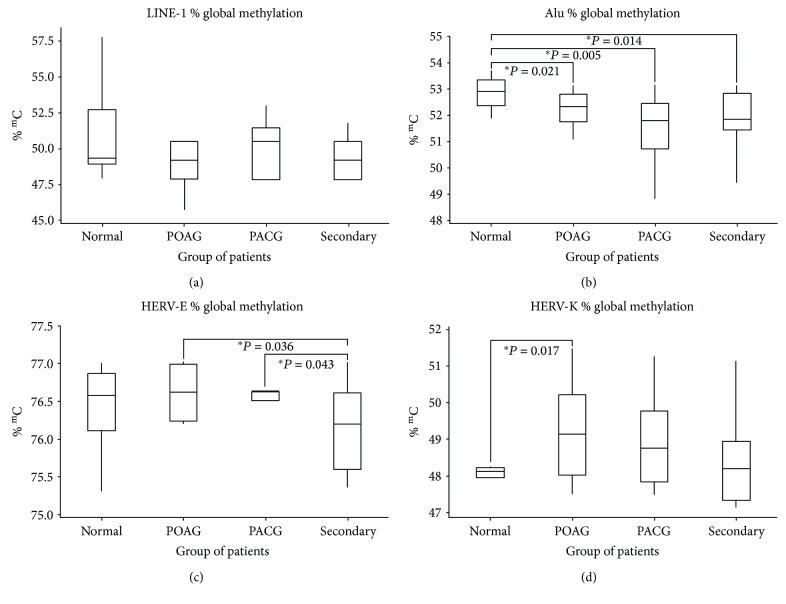
Figure 4.
Box plots showing methylation percentage: (a) LINE-1 methylation analysis, (b) Alu methylation analysis, (c) HERV-E methylation analysis, and (d) HERV-K methylation analysis. POAG = primary open-angle glaucoma; PACG = primary angle-closure glaucoma; secondary = secondary glaucoma; % mC = percentage of methylation. ∗ represents a significant difference at p < 0.05 by Wilcoxon rank-sum test.

