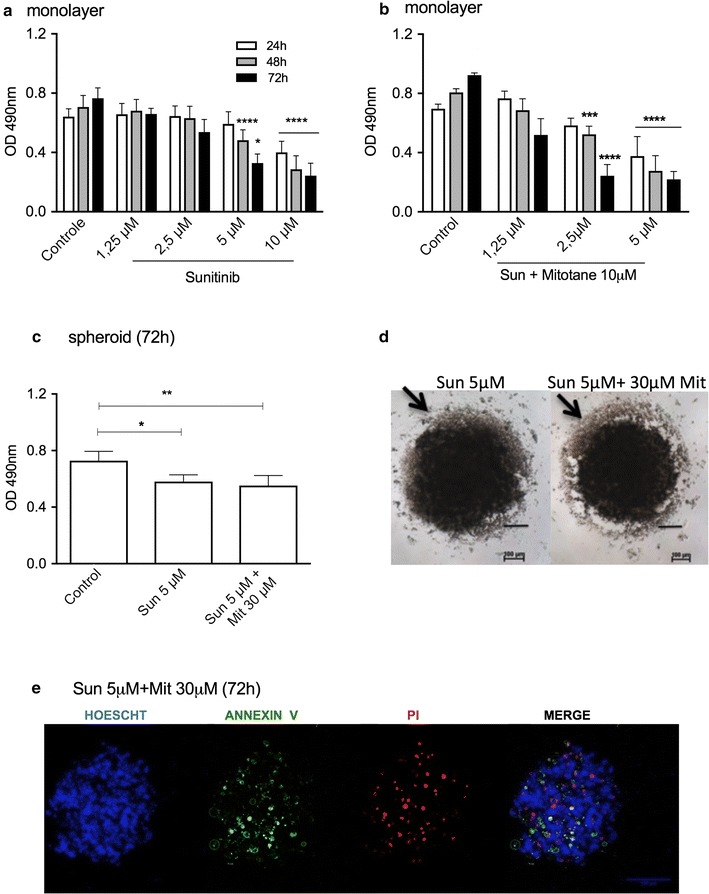
Fig. 5.

Cell viability analysis of H295R cell line treated with sunitinib (Sun) alone or with mitotane (Mit). MTS assay in monolayer cells after Sun treatment for 3 days (a) and (b) a combination of Sun and 10 μM Mit for 72 h; (c) MTS assay in spheroids after treatment with Sun or a combination of Sun and Mit; (d) phase-contrast photomicrography of spheroids after 72 h of treatment; (e) confocal microscopy images of spheroids after 72 h of treatment (100 μm). The results are expressed as the mean ± SEM; ANOVA *p < 0.05; **p < 0.01; ***p < 0.001; ****p < 0.0001; n = 3–4
