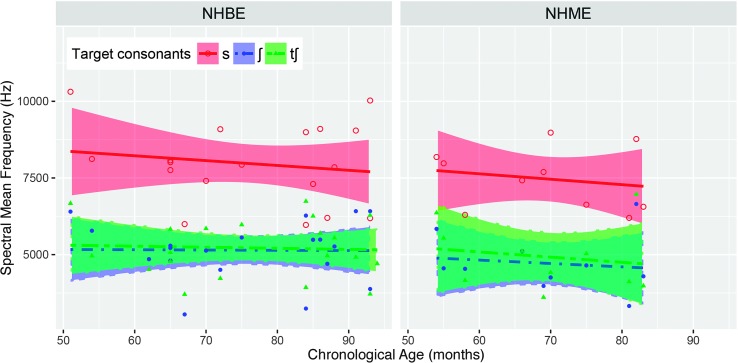
Figure 5.
Scatterplots of spectral mean frequencies of the three English target consonants (i.e., /s/, /ʃ/, and /tʃ/) as a function of children's chronological age produced by the two groups of children with normal hearing: bilingual children (NHBE) and monolingual English-speaking children (NHME). Each data point represents the average spectral mean frequency value for a specific target consonant produced by a single child. Lines/dashed lines indicated the best-fitted lines for the regression models of each target. For each model, the dependent variable is spectral mean frequency, and the independent variable is children's chronological age (in months). Shaded bands indicate 95% confidence interval.

