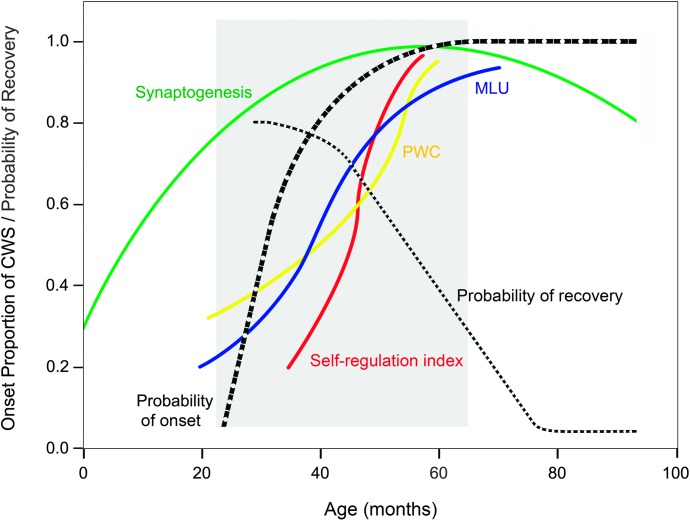
Figure 2.
These continuous line plots are interpolations on the basis of data available from the relevant literature. Gray area: the time window when stuttering onset and the pathways to persistence or recovery typically occur (on the basis of data from Yairi & Ambrose, 2005). Black dotted lines: Thicker line, the cumulative percentage of stuttering onsets as a function of age; thinner line, the probability of recovery as a function of age (Yairi & Ambrose, 2005). Other lines are selected to show developmental trajectories of neural and behavioral processes codeveloping during this window of time. Green curve: Growth of synapses and the beginning of synaptic pruning in the prefrontal cortex (units are synapses/100 μm3; range plotted is 10 to 60 synapses/100 μm3; adapted from Huttenlocher & Dabholkar, 1997). Blue curve: Growth of mean length of utterance (MLU) in morphemes (range one to five morphemes; J. F. Miller & Chapman, 1981; Rice et al., 2010). Yellow curve: Increase in percentage of whole words correct (PWC) a child produces, range approximately 30% to 88% (Rvachew & Brosseau-Lapré, 2012, pp. 240–245). Red curve: Index of the growth in the child's self-regulatory skills in a behavioral inhibition task. As the plot shows, at 36 months, children correctly inhibited their behavioral responses on just 22% of the trials, and children just 1 year older correctly inhibited with 91% accuracy (adapted from L. B. Jones et al., 2003). See text for more detailed explanation. CWS = children who stutter.

