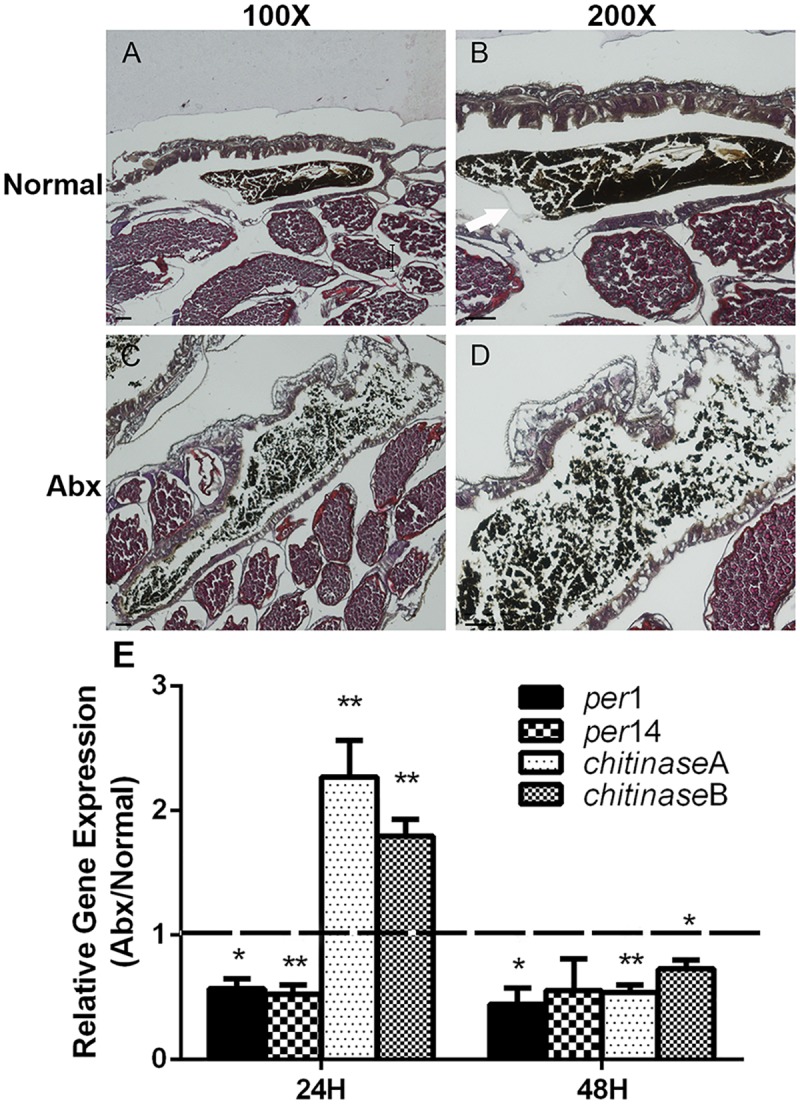
Fig 4. PM structural integrity in normal and antibiotic treated mosquitoes.

PM structure was observed by H&E staining in normal (A and B) and antibiotic treated mosquitoes (C and D) at 100X (A and C) and 200X (B and D) magnification. Arrows denote the PM. Images are representative of three independent experiments. Scale bars, 50 μm. (E) Quantification of PM related gene expression in normal and antibiotic treated mosquitoes 24hr and 48 hr post blood meal. Error bars indicate standard error (n = 10).
