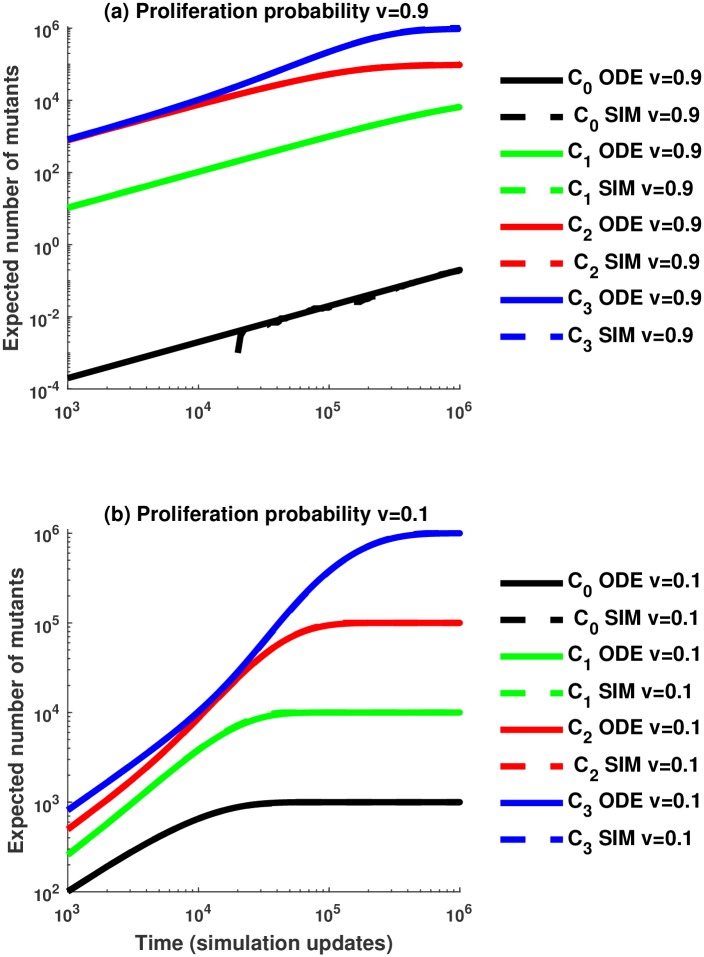
Fig 3. Comparison between the average number of mutants from 100 stochastic simulations without replacement and the number of mutants predicted by the ODE approximation.
(a) Comparing the number of mutants for a high value of the proliferation probability, v = 0.9. (b) Comparing the number of mutants when the proliferation probability is small, v = 0.1. Solid lines correspond to the number of mutants in compartment Ci, i = 1, …, 3, predicted by the ODE approximation and dashed lines correspond to the mean number of mutants in compartment Ci from the stochastic simulations. We assume n = 3, a mutation rate of u = 10−3, and the compartment sizes are N0 = 1063, N1 = 104, N2 = 105, N3 = 106.

