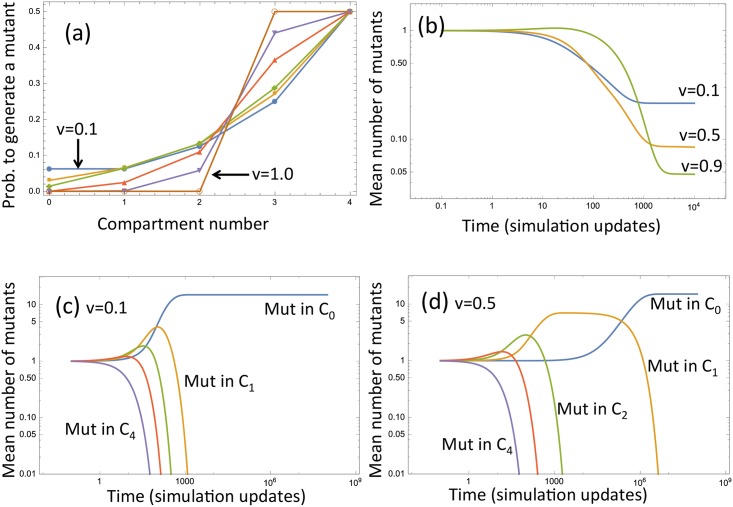
Fig 4. The role of the self-renewal rate on mutant generation and mutant dynamics (the analytical approach).
(a) The probability of generating a mutant in each of the compartments for 6 different values of v: v = 0, 0.05, 0.1, 0.4, 0.7, 1. (b) The expected number of mutants produced from a single mutant cell in the absence of further de-novo mutations, plotted as a function of time for three different values of v. (c,d) The expected dynamics of mutants generated in different compartments at t = 0, in the absence of new mutations, for (c) v = 0.1 and (d) v = 0.5. Other parameters are: n = 4, and the compartment sizes are, from C0 to Cn: 40, 80, 120, 160, 200.

