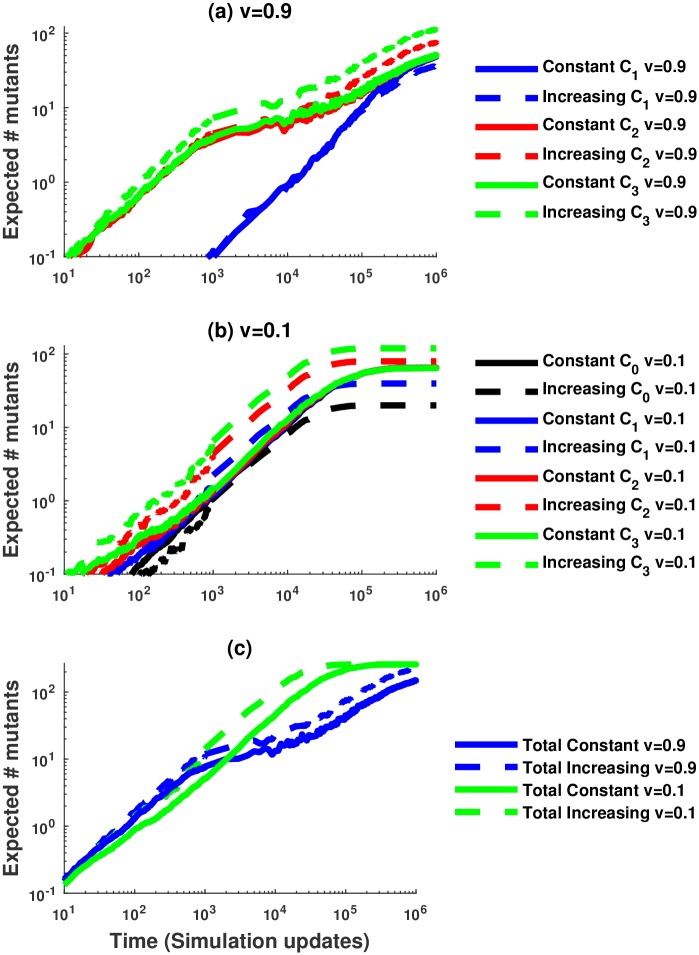
Fig 5. Mean number of mutants from 1000 stochastic simulations.
We compare two arrangements of the compartment sizes for n = 3: constant from C0 to C3 (N0 = 65, N1 = 65, N2 = 65, N3 = 65) and increasing from C0 to C3 (N0 = 20, N1 = 40, N2 = 80, N3 = 120). (a) The mean number of mutants produced in compartments C1, C2 and C3 for v = 0.9. Note that no mutants were produced in compartment C0 over the time scale shown. (b) The mean number of mutants produced in compartments C0, C1, C2 and C3 for v = 0.1. (c) The mean of the total number of mutants comparing both architectures for v = 0.9 (blue line) and v = 0.1 (green line). For all panels, solid lines correspond to constant architecture and dashed lines to increasing architecture. In these simulations u = 0.001.

