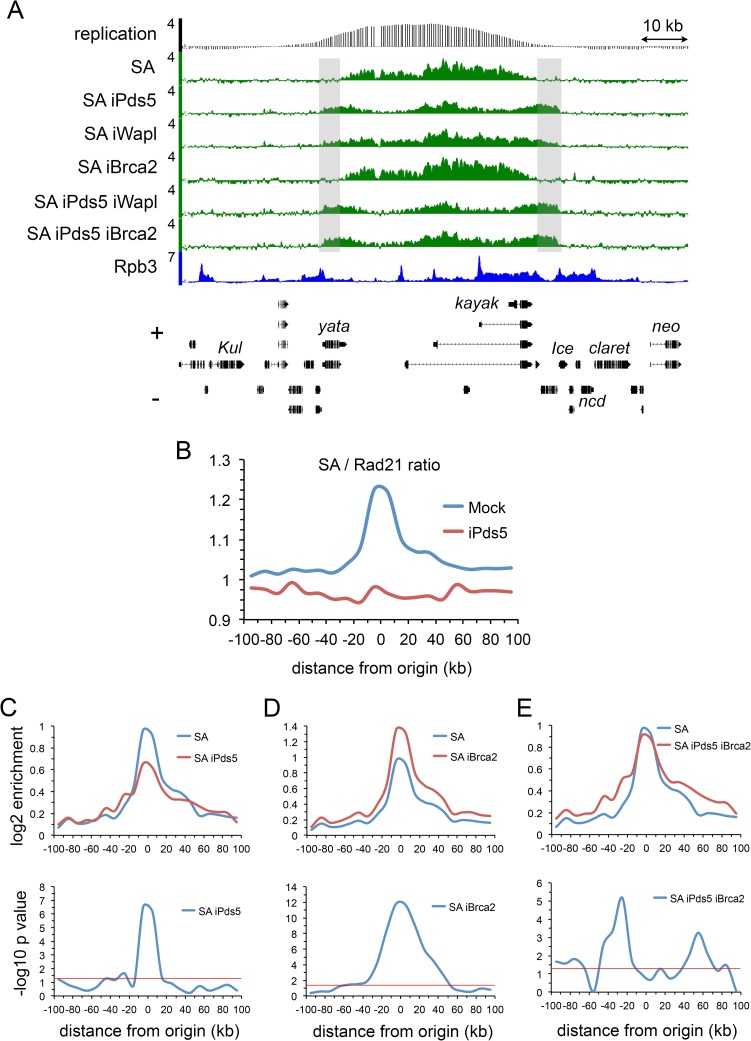
Fig 4. Pds5 and Brca2 have opposing effects on SA cohesin subunit levels at DNA replication origins.
(A) Genome browser view of SA ChIP-seq at the kayak locus in mock-treated BG3 cells (SA) and BG3 cells RNAi depleted for Pds5 (iPds5), Wapl (iWapl), Brca2 (iBrca2), Pds5 and Wapl (iPds5 iBrca2) and Pds5 and Brca2 (iPds5 iBrca2). (B) Metaorigin analysis of the SA to Rad21 ChIP-seq enrichment ratio in mock control cells (Mock, blue) and cells depleted for Pds5 (iPds5, red). (C) The top panel is the metaorigin plot of SA enrichment in control (SA, blue) and Pds5-depleted cells (SA iPds5, red). The bottom panel is the meta-origin plot of–log10 p values for the difference in SA enrichment calculated using the Wilcoxon signed rank test. (D) Same as C except for cells depleted for Brca2 (iBrca2). An example of the increase in SA at the kayak locus is shown in S2C Fig. (E) Same as C with cells depleted for both Pds5 and Brca2 (iPds5 iBrca2).

