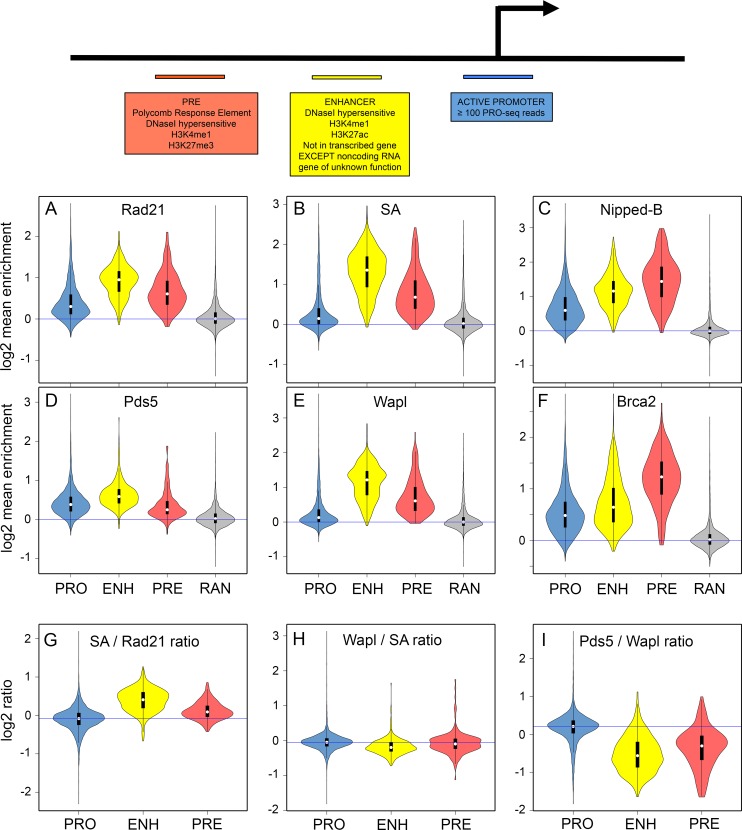
Fig 6. The relative levels of cohesin, Nipped-B, Pds5, Wapl and Brca2 vary between active promoters, enhancers and Polycomb Response Elements (PREs).
The top diagram summarizes how active promoters (blue) extragenic enhancers (yellow) and PREs (orange) are defined as 500 bp sequences as described elsewhere [17, 19, 33]. There are 7,389 non-heterochromatic active promoters, 523 extragenic enhancers and 195 PREs. There are over 2,500 total active enhancers in BG3 cells but intragenic enhancers are excluded to avoid effects caused by changes in transcription. (A) Violin plots of the distribution of Rad21 ChIP-seq enrichment values (mean enrichment in each 500 bp element) for promoters (PRO, blue), extragenic enhancers (ENH, yellow) and PREs (PRE, orange), and 6,892 random 500 bp sequences as a negative control. White dots show the median values. (B) Same as A for SA. (C) Same as A for Nipped-B. (D) Same as A for Pds5. (E) Same as A for Wapl. (F) Same as A for Brca2. (G) Distribution of SA to Rad21 ChIP-seq enrichment ratios for promoters (PRO) enhancers (ENH) and PREs (PRE). (H) Same as G for the Wapl to SA ratio. (I) Same as G for the Pds5 to Wapl ratio.

