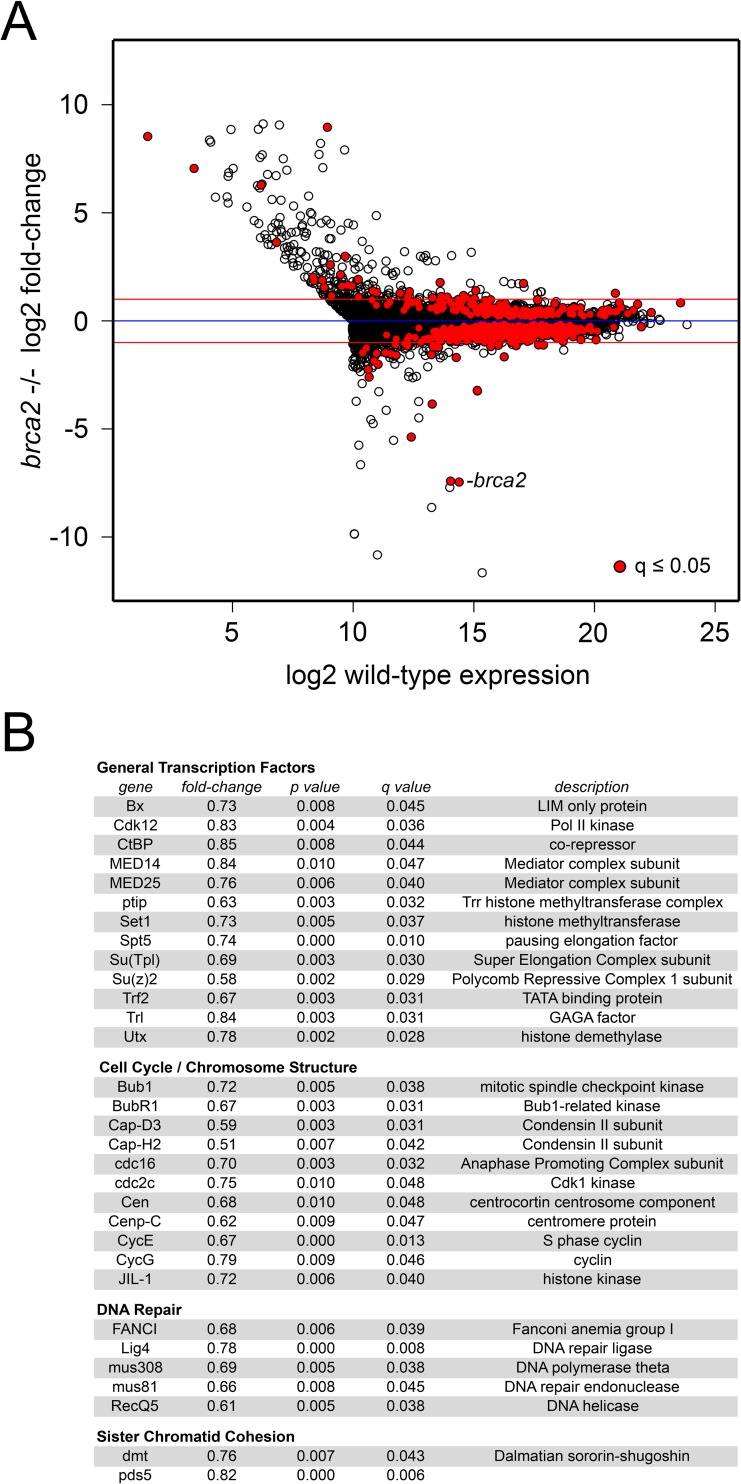
Fig 9. Brca2 influences gene expression in developing wings.
(A) The log2 fold-change in gene expression in brca2 null mutant 3rd instar wing imaginal discs is plotted versus the log2 expression level in control wing discs for all active genes. Active genes are defined as those that are expressed at or above the median level in control discs plus those expressed at or above the control median level in brca2 mutant discs. Red dots indicate statistically significant changes in gene expression (q ≤ 0.05). The dot representing the brca2 gene is labeled. The blue line indicates no change, and the two red lines indicate 2-fold increases or decreases. (B) Examples of genes down-regulated in brca2 mutant discs in the indicated categories. This is not a comprehensive list, which can be generated from the expression data provided in S1 Data.

