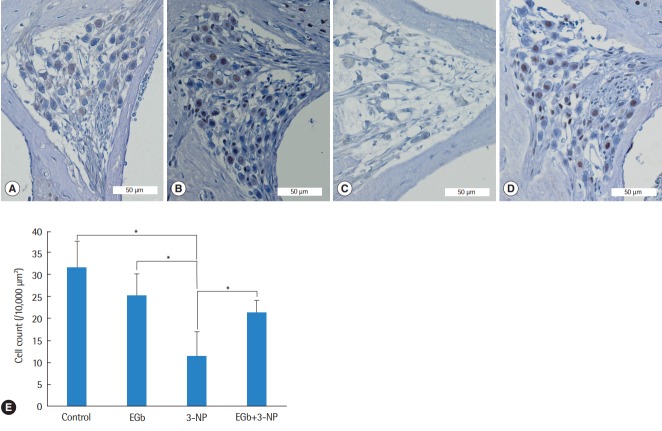
Fig. 3.
Light microscopic images of the spiral ganglion and spiral ganglion cell counts in the second turn of the cochlea. Compared with control group (A), spiral ganglion cells in EGb group (B) were not reduced, while spiral ganglion cells in 3-NP group (C) were reduced remarkably. Spiral ganglion cells in EGb+3-NP group (D) were remarkably preserved compared with 3-NP group (A-D; H&E, ×100). (E) Spiral ganglion cells in 3-NP group were reduced significantly compared with control group. Spiral ganglion cells in EGb group were not reduced compared with control group. Spiral ganglion cells in EGb+3-NP group were significantly preserved compared with 3-NP group. Error bar is a standard error. 3-NP, 3-nitropropionic acid. *Statistically significant difference between the two groups (P<0.05).

