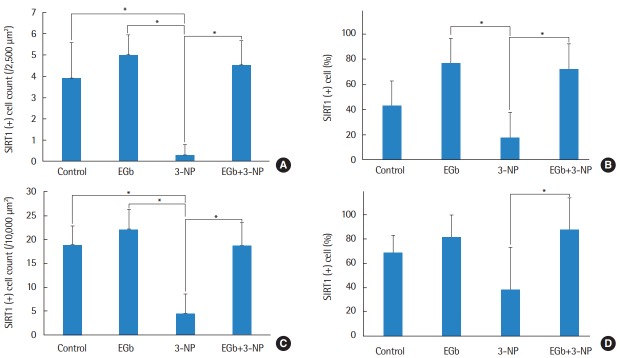
Fig. 5.
The mean cell counts (A) and proportion (B) of SIRT1 immunoreactive type II fibrocyte. Three-NP group showed significantly lower SIRT1 immunoreactive type II fibrocytes than control, EGb, and EGb+3-NP groups (P<0.001, P=0.007, and P=0.011, respectively). The proportion of SIRT1 immunoreactive type II fibrocytes in 3-NP group was significantly lower than EGb and EGb+3-NP groups (P =0.001 and P<0.001, respectively). The mean cell counts (C) and percentage (D) of SIRT1 immunoreactive spiral ganglion cell. Three-NP group showed significantly lower SIRT1 immunoreactive spiral ganglion cell than control, EGb, and EGb+3-NP groups (P<0.001, P<0.001, and P=0.011, respectively). The proportion of SIRT1 immunoreactive spiral ganglion cells in 3-NP group was significantly lower than EGb+3-NP group (P =0.009). Error bar is a standard error. SIRT1, Sirtuin 1; 3-NP, 3-nitropropionic acid. *Statistically significant difference between the two groups (P<0.05).

