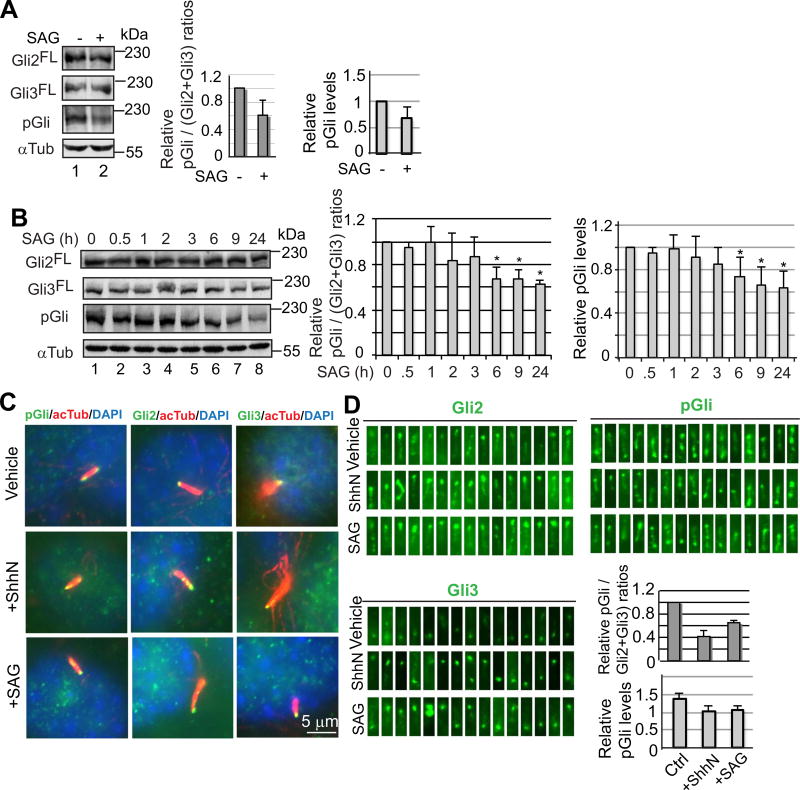
Fig. 2.
Hedgehog signaling inhibits PKA-mediated Gli2 and Gli3 phosphorylation in cilia. (A) Immunoblots showing the levels of Gli2FL, Gli3FL, and phosphorylated Gli2 and Gli3 (pGli) in C3H10T1/2 cells. Graphs show the relative pGli levels either with or without being normalized to those of Gli2FL and Gli3FL. Two-tailed Student t-test p-value = 0.034 < 0.5. (B) Immunoblots showing the time course of the levels of Gli2FL, Gli3FL, and pGli in response to SAG. Graphs to the right show the relative pGli/(Gli2+Gli3) or pGli values. P-values ≤ 0.0067 for bar graphs marked with *. (C) Representative images showing Gli2, Gli3, and pGli staining in cilia before and after treatment with ShhN or SAG. (D) Fifteen randomly chosen cilia that show positive staining for Gli2, Gli3, and pGli. The graphs show the arbitrary intensity of pGli staining per cilia by either with (upper graph) or without (lower graph) being normalized against Gli2FL and Gli3FL levels. Two-tailed Student t-test p-value ≤ 0.00057 (upper graph) or 0.036 (lower graph), respectively.

