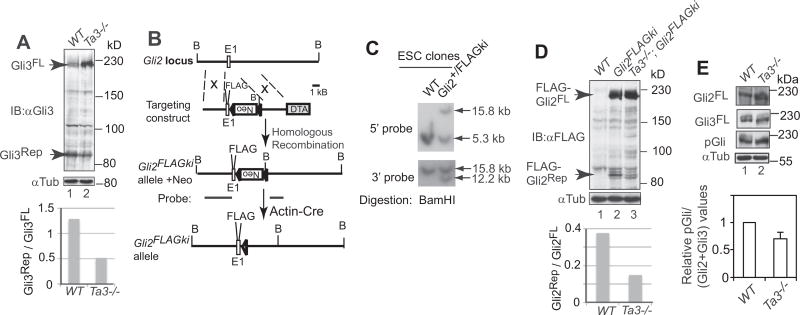
Fig. 3.
The processing and PKA-mediated phosphorylation of Gli2 and Gli3 were diminished in Ta3 mutant cells. (A, D, E) Immunoblots for Gli3, FLAG-Gli2, Gli2, and pGli in wt and Ta3 mutant embryos. Tubulin immunoblots are loading controls. Graphs show the ratios of Gli3Rep to Gli3FL and FLAG-Gli2Rep to FLAG-Gli2FL and relative pGli to (Gli2+ Gli3) values. Two-tailed Student t-test p-value = 0.0136 for E. from three independent experiments. (B) The gene targeting strategy to create Gli2FLAGki allele. E1, exon 1; FLAG, 3×FLAG tag; Neo, pGkneo cassette in a reverse orientation; triangle, loxP site; DTA, diphtheria toxin A; B, BamHI site. (C) Southern blot showing wt and a representative Gli2FLAGki ES cell clone with probes shown in B.

