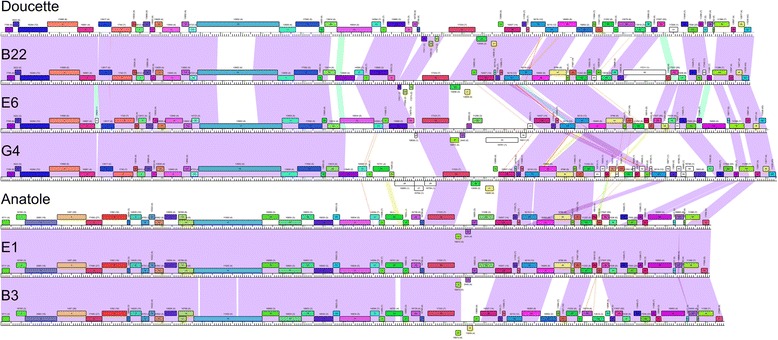
Fig. 4.

Whole genome comparisons of P. freudenreichii bacteriophages. The genome organizations of seven P. freudenreichii bacteriophages are shown with the pairwise nucleotide sequence similarities displayed as colored segments between the genomes. The strength of sequence similarity is represented according to a color spectrum in which violet is the most similar and red is the least (above a threshold BLASTN E-value of 10− 5). Predicted genes are shown as colored boxes either above or below each genome, representing leftwards- and rightwards-transcription, respectively. The gene numbers are shown within each colored box, and its phamily number is shown above, with the number of phamily members shown in parentheses; coloring reflects the phamily assignment. The maps were generated using the program Phamerator [40] and database Actinobacteriophage_685
