Fig. 5.

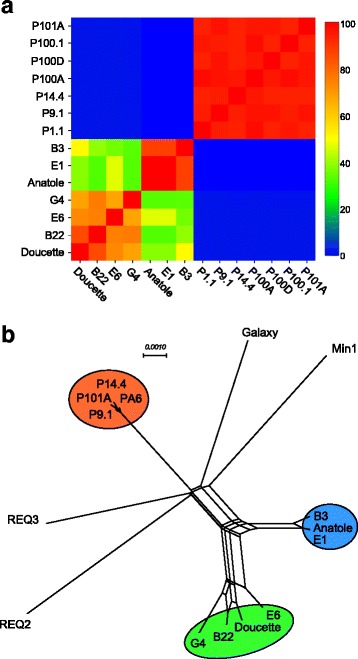
Relationships between Propionibacteriophages and Cutibacteriophages. a Heat map representation of shared gene content between seven P. freudenreichii phage genomes and seven C. acnes phage genomes. The proteins encoded by C. acnes phages (P101A, P100.1, P100D, P100A, P14.4, P1.1) and P. freudenreichii phages (Cluster BW: G4, E6, B22, Doucette; Cluster BV: B3, E1, Anatole) were assorted into phamilies using Phamerator [40] and the proportions of shared genes calculated. The scale on the right shows heat map colors with percent of shared genes. b Gene content relationships between P. freudenreichii phages and phages of related hosts. The relationships between the seven P. freudenreichii phages and a selection of phages that infect other bacteria in the Actinobacteria phylum were compared according to shared gene content using Phamerator and displayed using the Neighbor Network function of SplitsTree [34]. Cluster BW phages of P. freudenreichii are shown in the green circle, Cluster BV phage of P. freudenreichii in the blue circle, and C. acnes phages in the orange circle. Galaxy and Min1 are phages of Mycobacterium and Microbacterium, respectively, and REQ2 and REQ3 are Rhodococcus phages
