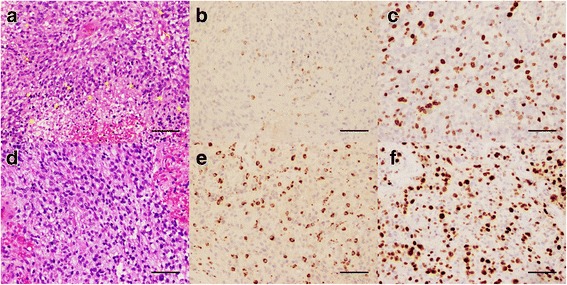
Fig. 2.

Tumor histology of patient P3. At initial diagnosis, H&E stain (a, 200X) reveals a high-grade glioma with pleomorphic tumor cells (arrows), increased mitotic figures (arrowheads), and areas of necrosis (stars). Histiocytes are minimal in number as stained by KP-1 (b, 200X). MIB-1 shows a high proliferative rate index (c, 200X). At 8.5 months after the initiation of ipilimumab, a new biopsy of the tumor still shows on H&E (d, 200X) a high-grade glial neoplasm with increased cellularity and mitotic figures. Reactive changes are present and abundant histiocytes are identified with KP-1 stain (e, 200X). MIB-1 demonstrates a high proliferative rate index, up to 40% in some areas. Scale bar for all panels measures 150 μm
