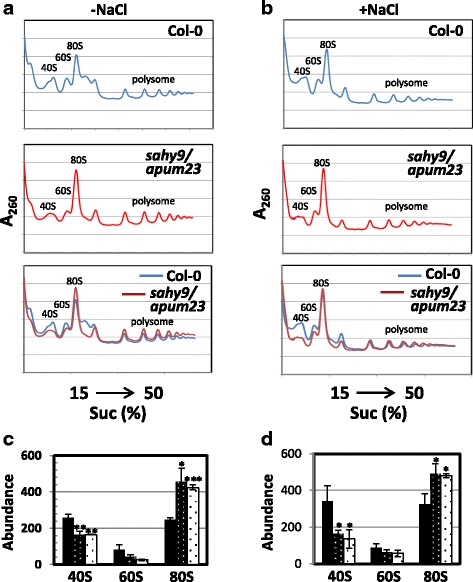
Fig. 5.

Changes in the ribosome subunit profile in the sahy9/apum23 mutant. a-b Analysis of the ribosome subunit profile using a sucrose gradient. c-d Quantified ribosome abundance derived from (a) and (b), respectively. Plants were grown vertically for 11 days on basal medium with or without 150 mM NaCl for 1 day. The values in (c) and (d) are the means ± SD of three independent experiments. *, P < 0.05; **, P < 0.01; ***, P < 0.001, Student’s t-test
