
Fig. 6.
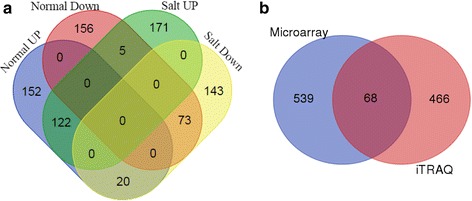
Overlap of identified transcripts and proteins in sahy9/apum23 under normal or salt stress conditions. a Venn diagram representing the overlap of the identified proteins under normal and salt stress conditions. b Venn diagram showing the overlap of the expression of transcripts and proteins under salt stress