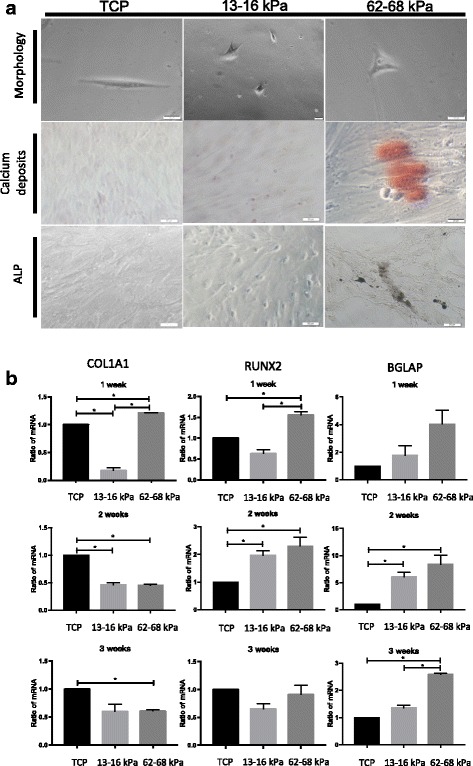
Fig. 3.

Osteogenic differentiation of hMSCs cultured on 62–68 kPa ECM. a Cells plated on indicated substrates for 1 week and then subjected to morphological analysis, Alizarin Red and alkaline phosphatase (ALP) staining. Scale bar = 20 μm. b Expression of osteoblast markers COL1AI, RUNX2, and BGLAP measured by qRT-PCR after 1, 2, and 3 weeks of culture. *P < 0.05. n = 3. TCP tissue culture plates, COLIAI alpha-1 chains of type I collagen, RUNX2 Runt related transcription factor 2
