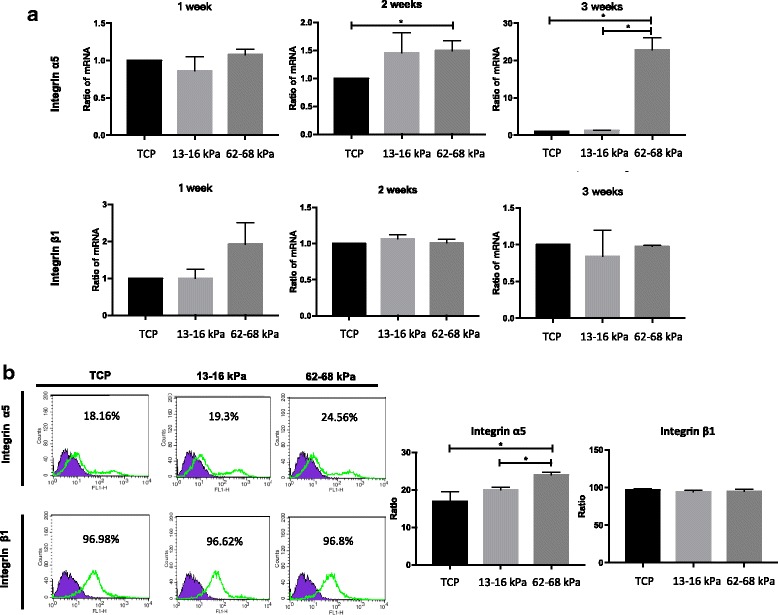
Fig. 5.

Integrin α5/β1 expression analysis of mRNA and surface protein during hMSC culturing on 13–16 kPa ECM, 62–68 kPa ECM, and TCP. a mRNA expression analysis of integrin α5 and integrin β1 at weeks 1–3. b Integrin α5/β1 surface protein expression determined by flow cytometry. *P < 0.05. n = 3. TCP tissue culture dishes
