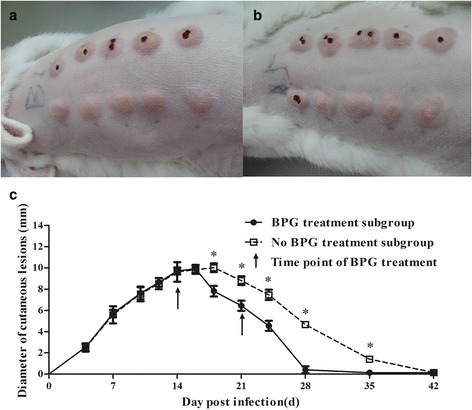
Fig. 1.

Dynamics of the cutaneous lesion size in rabbits infected with T. pallidum. a Lesions of one representative rabbit in the BPG treatment subgroup at 16 d. b Lesions of one representative rabbit in the no BPG treatment subgroup at 18 d. c Dynamics of the cutaneous lesion size in rabbits infected with T. pallidum. The arrow shows the time point of BPG treatment. The results are expressed as the mean ± SD. Student’s t-test was applied to compare the means of the diameters between the BPG treatment and no BPG treatment subgroups. *P < 0.05
