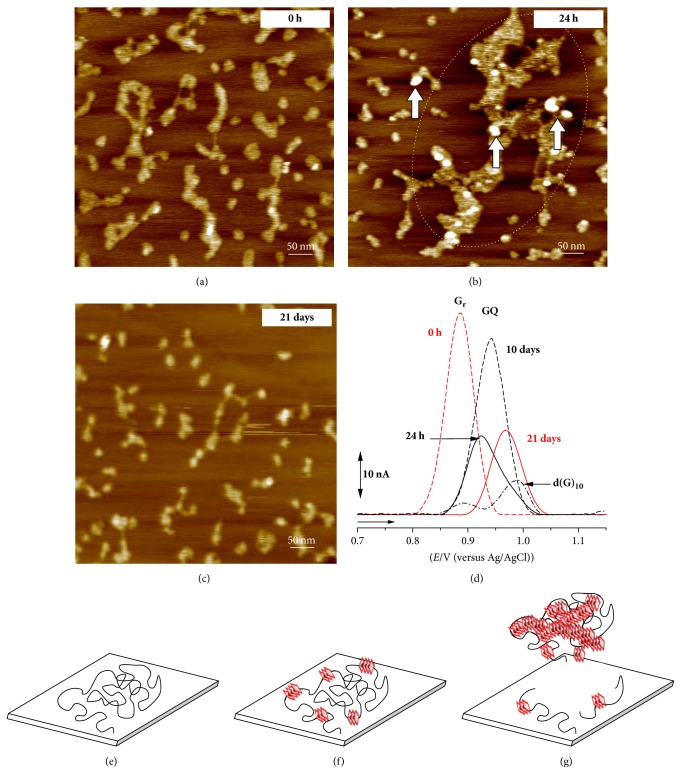
Figure 4.
(a–c) AFM images of 5 μg mL−1 poly(G) in pH 7.0, in the presence of K+ ions, at (a) 0 h, (b) 24 h, and (c) 21 days' incubation; (d) DP voltammograms baseline corrected in 100 μg mL−1 poly(G) in pH 7.0, in the presence of K+ ions, at (red dashed line) 0 h, (black solid line) 24 h, (black dashed line) 10 days, and (red solid line) 21 days' incubation and control (black dashed-dotted line) 3 μM d(G)10 at 24 h incubation; (e–g) representation of poly(G) adsorption process: (e) poly(G) single-strand, (f) poly(G) single-strand with short GQ regions, and (g) poly(G) single-strand with larger GQ regions. [Reproduced from [52] with permission.]

