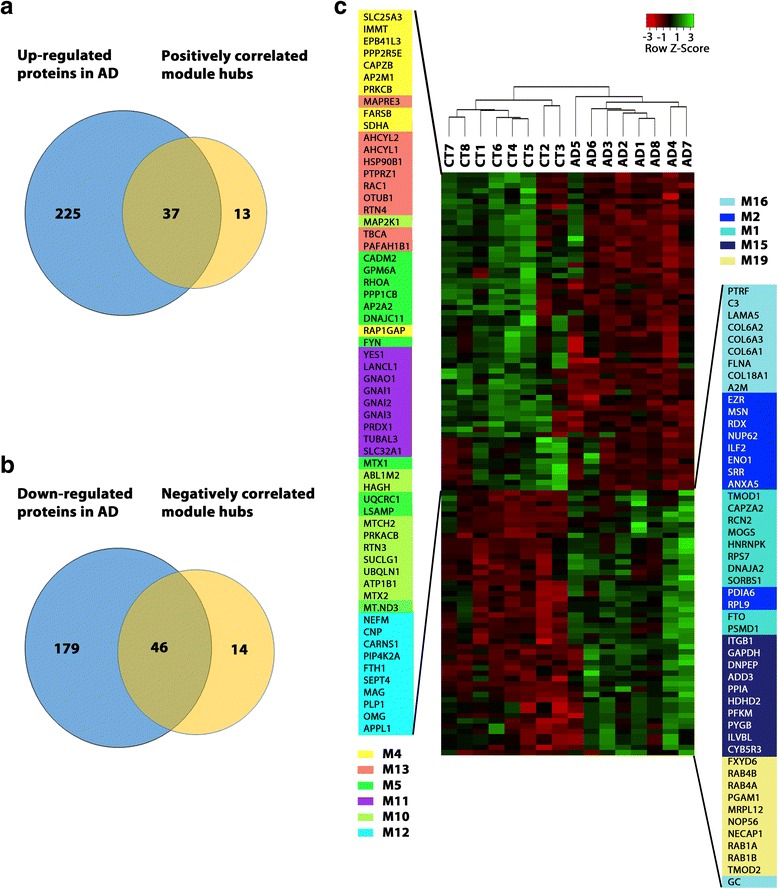
Fig. 8.

Hub proteins of AD-related modules provide a molecular signature for differentiating AD and control cases. a Venn diagram showing the overlap between the identified up-regulated proteins in AD and top intramodular hub proteins of co-expression modules with positive correlation to AD phenotypes. b Venn diagram showing the overlap between the identified down-regulated proteins in AD and top intramodular hub proteins of co-expression modules with negative correlation to AD phenotypes. c Heat map representing the expression profiles of 110 highly connected intramodular hub proteins after unsupervised hierarchical clustering, showing clear separation of AD from control (CT) cases and positively correlated module hub proteins from negatively correlated module hub proteins
