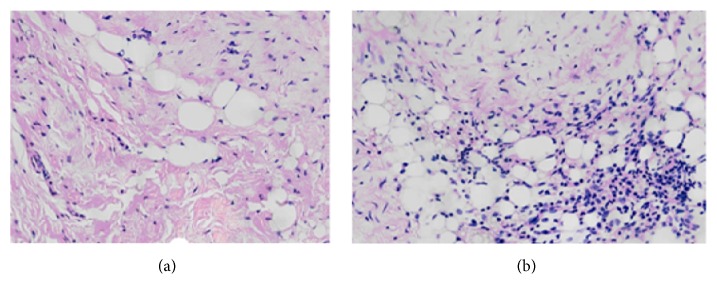
Figure 3.
Results of H&E staining of synovial tissue (100x, bar = 100 μ). (a) No obvious infiltration of inflammatory cells and fewer plicae were found in the synovial tissue of the control group. (b) There were abundant inflammatory cells infiltrating the synovium in the study group, combined with the proliferation of fibrous connective tissue.

