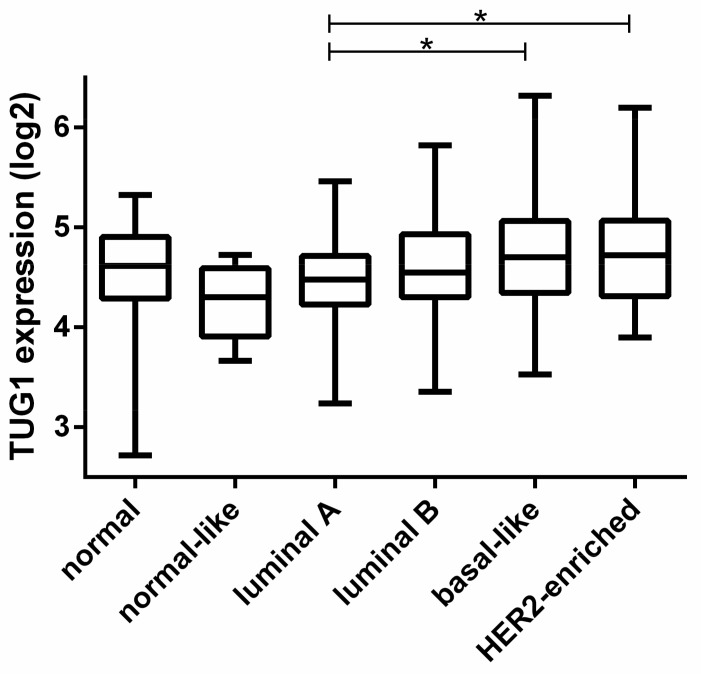
Figure 1.
Expression analysis of the taurine upregulated 1 gene (TUG1) transcript in Prediction Analysis on Microarrays that uses a minimal gene set (PAM50) breast cancer subgroups. TUG1 expression data were from “The Cancer Genome Atlas (TCGA)”, and the PAM50 gene signatures rely on 50 discriminatory genes to segregate tumors into luminal A (n = 227), luminal B (n = 122), human epidermal growth factor receptor 2 (HER2)-enriched (n = 56), basal-like (n = 94), and “normal-like” (n = 7). Samples categorized as “normal” are adjacent non-tumor breast tissue (n = 105). * p < 0.001.

