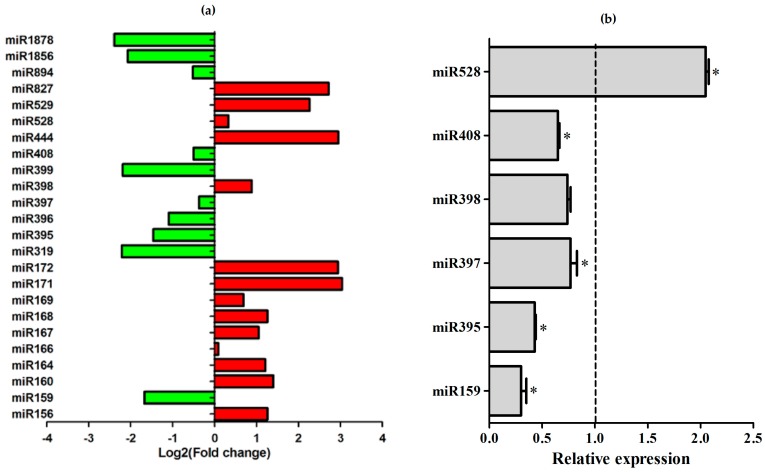
Figure 5.
Expression analysis of the miRNAs in response to bacterial infection. (a) miRNA expression levels from bioinformatics analysis; (b) Validation of bioinformatics expression profiles of selected miRNAs by real-time PCR, using Rep 1 samples. The expression of six miRNAs was tested in mock-inoculated plants and Acidovorax avenae-infected plants. Dotted line represents the expression of the control samples. The error bars represent the standard deviation between three technical replicates. * represents significant changes of target expression between the control and inoculated samples (p-value < 0.05).

